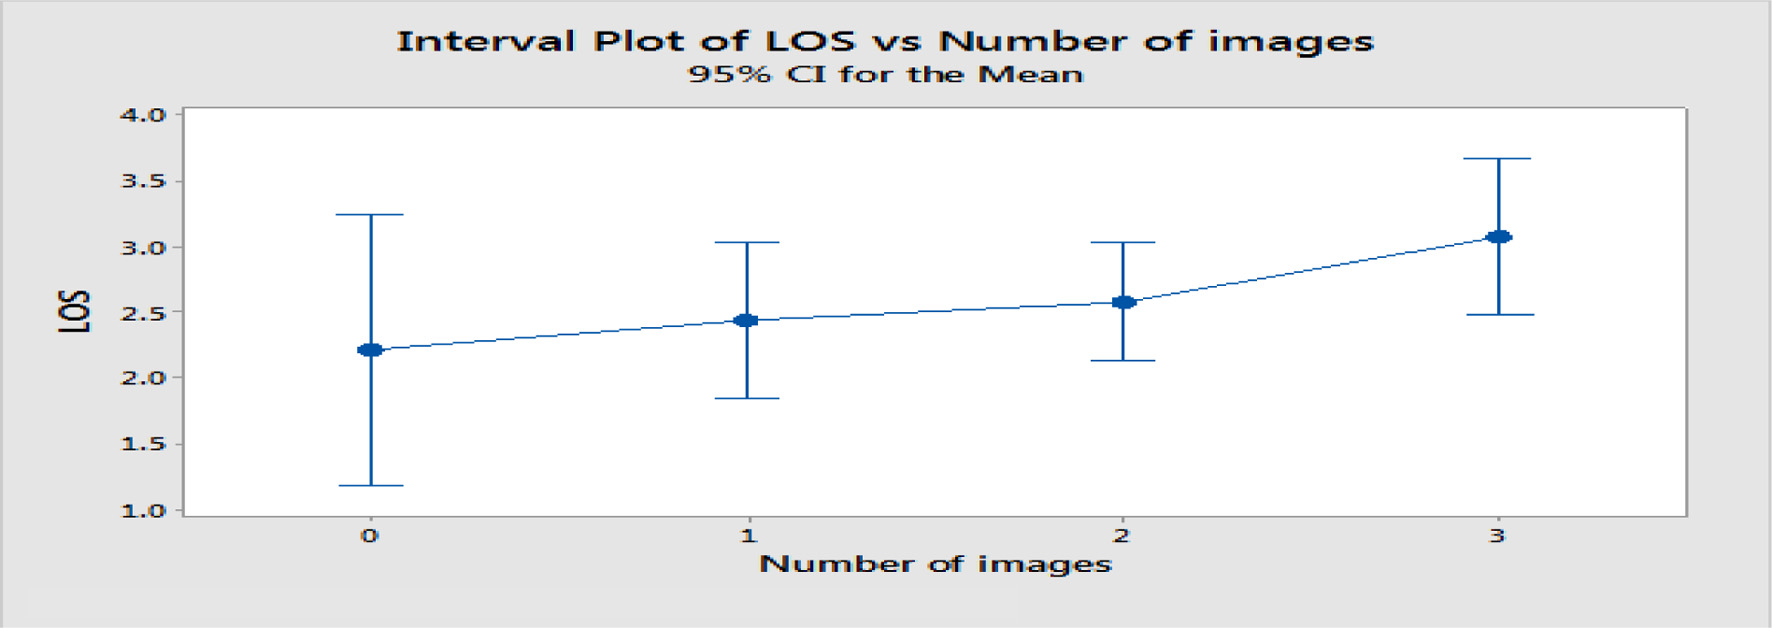
Figure 1. Interval plot of hospital length of stay (LOS) in correlation with number of imaging test ordered. LOS: length of stay. The pooled standard deviation was used to calculate the intervals.
| Cardiology Research, ISSN 1923-2829 print, 1923-2837 online, Open Access |
| Article copyright, the authors; Journal compilation copyright, Cardiol Res and Elmer Press Inc |
| Journal website https://www.cardiologyres.org |
Original Article
Volume 9, Number 4, August 2018, pages 197-203
Utilization of Echocardiogram, Carotid Ultrasound, and Cranial Imaging in the Inpatient Investigation of Syncope: Its Impact on the Diagnosis and the Patient’s Length of Hospitalization
Figure
Tables
| N = 109(%) | |
|---|---|
| Age | 68.74 ± 21.04 years |
| Male | 43 (39.44%) |
| Female | 66 (60.55%) |
| Race | |
| White | 72 (66.05%) |
| Black | 18 (16.51%) |
| Hispanic | 13 (11.92%) |
| Asian | 4 (3.66%) |
| Other | 2 (1.83%) |
| Common Comorbidities | |
| Hypertension | 69 (63.30%) |
| Hyperlipidemia | 35 (32.11%) |
| Coronary artery disease | 22 (20.18%) |
| Hypothyroidism | 18 (16.82%) |
| Diabetes mellitus | 17 (15.59%) |
| Atrial fibrillation | 15 (16.51%) |
| Anemia | 15 (13.76%) |
| Cerebrovascular accident | 11 (10.09%) |
| Chronic kidney disease | 11 (10.09%) |
| Dementia | 11 (10.09%) |
| Common Medications | |
| Statin | 37 (33.94%) |
| Antiplatelet | 37 (33.94%) |
| Beta blocker | 36 (33.02%) |
| Calcium channel blocker | 32 (29.35%) |
| Multivitamins | 23 (21.10%) |
| Angiotensin converting enzyme inhibitor | 22 (20.18%) |
| Selective serotonin reuptake inhibitor | 20 (18.34%) |
| Thyroid hormone | 19 (17.43%) |
| Angiotensin receptor block | 15 (13.76%) |
| Anticonvulsant | 13 (11.92%) |
| N = 109(%) | |
|---|---|
| Orthostatic vital signs | |
| Done | 45 (41.28%) |
| Positive | 23 (51.11%) |
| Not done | 64 (58.71%) |
| Telemetry | |
| Ordered | 106 (97.24%) |
| Normal sinus rhythm | 85 (80.18%) |
| Sinus bradycardia | 14 (13.20%) |
| Bundle branch block | 14 (13.20%) |
| First degree atrioventricular block | 10 (9.43%) |
| Atrial fibrillation/flutter | 7 (6.60%) |
| Premature atrial contraction | 3 (2.83%) |
| Paced rhythm | 3 (2.83%) |
| Nonsustained ventricular tachycardia | 3 (2.83%) |
| Supraventricular tachycardia | 1 (0.94%) |
| Sinus arrhythmia | 1 (0.94%) |
| Sinus tachycardia | 1 (0.94%) |
| Not ordered | 3 (2.83%) |
| Electrocardiogram | |
| Ordered | 106 (97.24%) |
| Normal sinus rhythm | 73 (68.86%) |
| Sinus bradycardia | 13 (12.26%) |
| Right bundle branch block | 13 (12.26%) |
| Nonspecific ST wave changes | 10 (9.43%) |
| Left ventricular hypertrophy | 10 (9.43%) |
| First degree atrioventricular block | 8 (7.54%) |
| Premature atrial contraction | 7 (6.60%) |
| Atrial fibrillation/flutter | 7 (6.60%) |
| Sinus tachycardia | 6 (5.66%) |
| Premature ventricular contraction | 6 (5.66%) |
| Sinus arrhythmia | 5 (4.71%) |
| Poor R wave progression | 5 (4.71%) |
| Left bundle branch block | 4 (3.77%) |
| Left anterior fascicular block | 4 (3.77%) |
| Intraventricular conduction delay | 4 (3.77%) |
| Lateral wall ischemia | 3 (2.83%) |
| Left atrial enlargement | 2 (1.88%) |
| Anterolateral wall ischemia | 1 (0.94%) |
| Old inferior wall myocardial infarction | 1 (0.94%) |
| Prolonged QT interval | 1 (0.94%) |
| Not ordered | 3 (2.83%) |
| Electroencephalogram | |
| Ordered | 49 (44.95%) |
| Negative | 47(95.91%) |
| Positive | 2 (4.08%) |
| Primary generalized epilepsy | 1 (50%) |
| Left temporal region epilepsy | 1 (50%) |
| Nuclear stress test | |
| Ordered | 4 (3.66%) |
| Positive | 0 (0%) |
| Negative | 4 (100%) |
| Tilt table test | |
| Ordered | 3 (2.75%) |
| Positive | 1 (33.33%) |
| Negative | 2 (66.66%) |
| Intracardiac loop recorder placement | |
| Ordered | 5(4.58%) |
| Pacemaker interrogation | |
| Ordered | 2 (1.83%) |
| Electrophysiological studies | |
| Ordered | 0 (0%) |
| N = 109(%) | |
|---|---|
| ICA: internal carotid artery. | |
| Cranial computed tomography | |
| Ordered | 83 (76.14%) |
| Normal | 56 (67.46%) |
| Microvascular disease | 17 (20.48%) |
| Chronic basal ganglia infarct | 5 (6.02%) |
| Hematoma | 2 (2.40%) |
| Meningioma | 2 (2.40%) |
| Chronic ischemic changes | 1 (1.20%) |
| Central cortical atrophy | 1 (1.20%) |
| Parenchymal volume loss | 1 (1.20%) |
| Calcification | 1 (1.20%) |
| Nonspecific white matter changes | 1 (1.20%) |
| Small intraparenchymal hemorrhage | 1 (1.20%) |
| Basal ganglia neuroepithelial cyst | 1 (1.20%) |
| Cavernous malformation | 1 (1.20%) |
| Hemorrhagic contusion | 1 (1.20%) |
| Acute Maxillary sinusitis | 1 (1.20%) |
| Not ordered | 26 (23.85%) |
| Carotid ultrasound | |
| Ordered | 36 (33.02%) |
| Normal | 31 (86.11%) |
| Proximal ICA bilateral stenosis (60-79%) | 1 (2.77%) |
| Proximal ICA bilateral stenosis (40-59%) | 1 (2.77%) |
| Right ICA stenosis (80-89%) | 1 (2.77%) |
| Bilateral stenosis ICA (40-59%) | 1 (2.77%) |
| Left ICA mild to moderate plaque | 1 (2.77%) |
| Not ordered | 73 (66.97%) |
| Echocardiogram | |
| Ordered | 76 (69.72%) |
| Diastolic dysfunction | 37 (46.68%) |
| Concentric hypertrophy | 27 (35.52%) |
| Normal | 14 (18.42%) |
| Mild mitral regurgitation | 12 (15.78%) |
| Mild tricuspid regurgitation | 9 (11.84%) |
| Mitral annulus calcification | 8 (10.52%) |
| Moderate to severe mitral regurgitation | 8 (10.52%) |
| Mild Aortic regurgitation | 5 (6.57%) |
| Moderate aortic regurgitation | 5 (6.57%) |
| Moderate aortic stenosis | 5 (6.57%) |
| Moderate tricuspid regurgitation | 5 (6.57%) |
| Mild aortic stenosis | 4 (5.26%) |
| Mild pulmonary hypertension | 4 (5.26%) |
| Mild left ventricular hypertrophy | 4 (5.26%) |
| Mild bilateral atrial enlargement | 4 (5.26%) |
| Moderate pulmonary hypertension | 2 (2.63%) |
| Severe right atrial enlargement | 2 (2.63%) |
| Mild to moderate global hypokinesis | 2 (2.63%) |
| Bioprosthetic valve | 2 (2.63%) |
| Severe tricuspid regurgitation | 1 (1.31%) |
| Speckled pattern | 1 (1.31%) |
| Severe pulmonary hypertension | 1 (1.31%) |
| Mild pericardial effusion | 1 (1.31%) |
| Mild mitral stenosis | 1 (1.31%) |
| Severe aortic stenosis | 1 (1.31%) |
| Mild asymmetric hypertrophy | 1 (1.31%) |
| Basal septum hypokinesis | 1 (1.31%) |
| Mild aortic root dilation | 1 (1.31%) |
| Mild basal septal hypertrophy | 1 (1.31%) |
| Primum atrial septal defect | 1 (1.31%) |
| Paramembranous ventricular septal defect | 1 (1.31%) |
| Endocardial cushion defect | 1 (1.31%) |
| Not ordered | 33 (30.27%) |
| N (%) | Length of stay in days | |
|---|---|---|
| No imaging test ordered | 9 (8.25%) | 2.22 |
| One imaging test ordered | 27 (24.77%) | 2.44 |
| Two imaging tests ordered | 46 (42.20%) | 2.58 |
| Three imaging tests ordered | 27 (24.77%) | 3.07 |
| Hospital length of stay | 0 test (N = 9) | 1 test (N = 27) | 2 tests (N = 46) | 3 tests (N = 27) | P (ANOVA) | P (KW) |
| Mean ± SD | 2.222 ± 1.481 | 2.444 ± 1.396 | 2.587 ± 1.627 | 3.074 ± 1.639 | 0.368 | |
| Median(minimum - maximum) | 1 (1 - 4) | 2 (1 - 7) | 2 (1 - 6) | 3 (1 - 7) | 0.352 |
| Number of imaging test ordered | Syncope | Vasovagal syncope | Syncope vs. seizure | Total |
|---|---|---|---|---|
| Chi-square P value = 0.4165, nominal logistic regression P value = 0.939. | ||||
| 0 | 7 (8.092) | 1 (0.330) | 1 (0.578) | 9 |
| 1 | 22 (24.275) | 2 (0.991) | 3 (1.734) | 27 |
| 2 | 43 (41.358) | 1 (1.688) | 2 (2.954) | 46 |
| 3 | 26 (24.275) | 0 (0.991) | 1 (1.734) | 27 |
| Total | 98 | 4 | 7 | 109 |
| Number of imaging test ordered | Syncope | Vasovagal syncope | Neurocardiogenic syncope | Syncope with seizure | Syncope vs. seizure | Total |
|---|---|---|---|---|---|---|
| Chi-square P value = 0.1507; nominal logistic regression P value = 0.782. | ||||||
| 0 | 8 (8.2569) | 0 (0.3303) | 0 (0.1651) | 0 (0.1651) | 1 (0.0826) | 9 |
| 1 | 23 (24.770) | 2 (0.9908) | 1 (0.4954) | 1 (0.4954) | 0(0.2477) | 27 |
| 2 | 43 (42.2018) | 2 (1.6881) | 0 (0.8440) | 1 (0.8440) | 0 (0.4220) | 46 |
| 3 | 26 (24.7706) | 0 (0.9908) | 1 (0.4954) | 0 (0.4954) | 0 (0.2477) | 27 |
| Total | 100 | 4 | 2 | 2 | 1 | 109 |
| N = 109 (%) | |
|---|---|
| Admitting diagnosis | |
| Syncope | 98 (89.90%) |
| Syncope with fall | 7 (6.42%) |
| Syncope vs. Seizure | 4 (3.66%) |
| Discharge diagnosis | |
| Syncope | 100 (91.74%) |
| Vasovagal syncope | 4 (3.66%) |
| Neurocardiogenic syncope | 2 (1.83%) |
| Syncope with seizure | 2 (1.83%) |
| Syncope vs. Seizure | 1 (0.91%) |