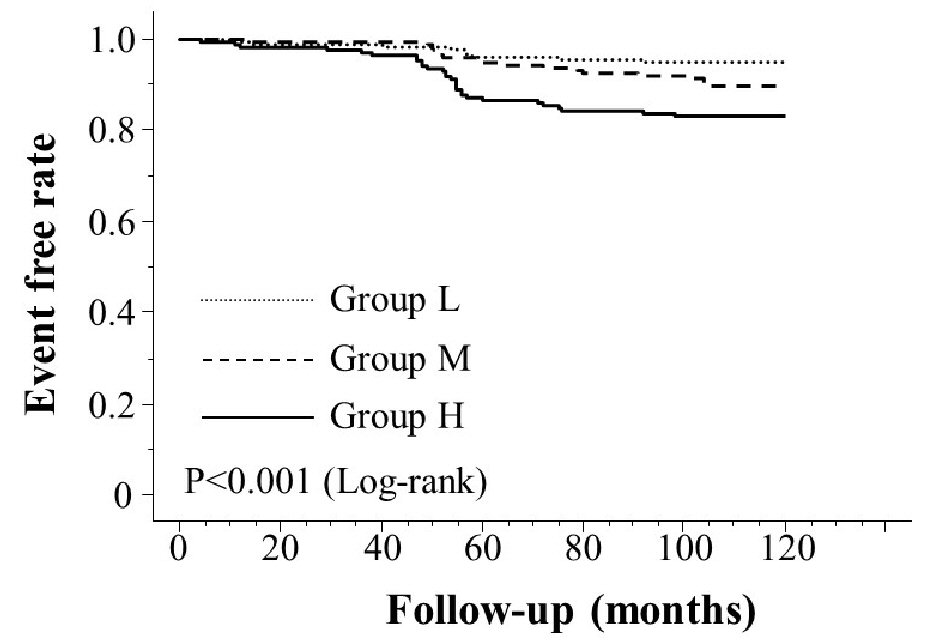
Figure 1. Kaplan-Meier curve for the incidence of major adverse cardiovascular events. The Kaplan-Meier curve confirmed that group H had a higher incidence of major adverse cardiovascular events compared to groups M and L (log-rank test, P < 0.001).
| Cardiology Research, ISSN 1923-2829 print, 1923-2837 online, Open Access |
| Article copyright, the authors; Journal compilation copyright, Cardiol Res and Elmer Press Inc |
| Journal website https://www.cardiologyres.org |
Original Article
Volume 9, Number 4, August 2018, pages 231-238
Usefulness of the Whole Blood Passage Time as a Predictor of Primary Cardiovascular Events in Patients With Traditional Cardiovascular Risk Factors
Figures
Tables
| Overall | Group L | Group M | Group H | P value | |
|---|---|---|---|---|---|
| Continuous values are mean ± SD. WBPT: whole blood passage time; SBP: systolic blood pressure; DBP: diastolic blood pressure; LDL: low-density lipoprotein; HDL: high-density lipoprotein; FBG: fasting blood glucose; hs-CRP: high sensitivity C reactive protein; CAVI: cardio-ankle vascular index; RAS: renin-angiotensin system. *P < 0.001 vs. group L, **P < 0.01 vs. group L, ***P < 0.05 vs. group L, #P < 0.001 vs. group M, ##P < 0.05 vs. group M. | |||||
| N (male/female) | 1,134 (438/696) | 499 (168/331) | 295 (111/184) | 340 (159/181)*## | < 0.001 |
| Age (yrs) | 67 ± 11 | 66 ± 11 | 67 ± 11 | 67 ± 11 | 0.136 |
| WBPT (s) | 57.0 ± 17.8 | 40.3 ± 5.2 | 59.6 ± 5.9 | 79.4 ± 8.5*# | < 0.001 |
| Risk factors | |||||
| Obesity, n (%) | 366 (32) | 137 (27) | 103 (35)*** | 126 (37)** | < 0.01 |
| Current smoker, n (%) | 227 (20) | 57 (11) | 56 (19) ** | 114 (34)*# | < 0.001 |
| Hypertension, n (%) | 844 (74) | 367 (74) | 215 (73) | 262 (77) | 0.405 |
| SBP(mm Hg) | 140 ± 13 | 139 ± 11 | 141 ± 9 | 141 ± 17 | 0.139 |
| DBP (mm Hg) | 88 ± 16 | 87 ± 10 | 89 ± 10 | 89 ± 25 | 0.108 |
| Dyslipidemia, n (%) | 805 (71) | 356 (71) | 207 (70) | 242 (71) | 0.936 |
| Diabetes mellitus, n (%) | 282 (25) | 105 (21) | 71 (24) | 106 (31)*## | < 0.01 |
| Blood findings | |||||
| Hematocrit (%) | 40 ± 5 | 39 ± 4 | 40 ± 5 | 41 ± 5*## | < 0.001 |
| White blood cell (/µL) | 6,645 ± 1,495 | 6,535 ± 1,514 | 6,650 ± 1,463 | 6,801 ± 1,486 | 0.501 |
| Platelet count (×104/µL) | 21 ± 5 | 21 ± 4 | 22 ± 5 | 21 ± 5 | 0.86 |
| Total cholesterol (mg/dL) | 223 ± 39 | 223 ± 40 | 220 ± 38 | 223 ± 40 | 0.157 |
| LDL cholesterol (mg/dL) | 146 ± 36 | 148 ± 37 | 144 ± 37 | 144 ± 35 | 0.103 |
| Triglyceride (mg/dL) | 125 ± 66 | 122 ± 66 | 122 ± 67 | 131 ± 64 | 0.098 |
| HDL cholesterol (mg/dL) | 52 ± 13 | 52 ± 13 | 51 ± 14 | 53 ± 13 | 0.546 |
| FBG (mg/dL) | 114 ± 27 | 111 ± 27 | 112 ± 26 | 119 ± 29*# | < 0.001 |
| Log-hs-CRP (mg/dL) | -1.3 ± 0.5 | -1.5 ± 0.4 | -1.4 ± 0.6 | -1.0 ± 0.4*# | < 0.001 |
| CAVI | 9.0 ± 1.2 | 8.8 ± 1.2 | 9.0 ± 1.2 | 9.4 ± 1.2*# | < 0.001 |
| Medication | |||||
| RAS inhibitor, n (%) | 418 (37) | 190 (38) | 115 (39) | 113 (33) | 0.454 |
| Statin, n (%) | 335 (30) | 145 (29) | 91 (31) | 99 (29) | 0.68 |
| Anti-diabetic drugs, n (%) | 236 (21) | 97 (19) | 51 (17) | 88 (26) | 0.174 |
| MACE (-) | MACE (+) | P value | |
|---|---|---|---|
| Continuous values are mean ± SD. SBP: systolic blood pressure; DBP: diastolic blood pressure; LDL: low-density lipoprotein; HDL: high-density lipoprotein; FBG: fasting blood glucose; hs-CRP: high sensitivity C reactive protein; CAVI: cardio-ankle vascular index; RAS: renin-angiotensin system. | |||
| N (male/female) | 1,039 (385/654) | 95 (53/42) | < 0.001 |
| Age (yrs) | 66 ± 11 | 70 ± 9 | < 0.01 |
| Obesity, n (%) | 329 (32) | 37 (39) | 0.146 |
| Current smoker, n (%) | 197 (19) | 30 (32) | < 0.01 |
| Hypertension, n (%) | 772 (74) | 72 (76) | 0.751 |
| SBP (mm Hg) | 139 ± 13 | 146 ± 16 | < 0.05 |
| DBP (mm Hg) | 88 ± 17 | 86 ± 11 | 0.286 |
| Dyslipidemia, n (%) | 738 (71) | 67 (71) | 0.918 |
| Diabetes mellitus, n (%) | 242 (23) | 40 (42) | < 0.001 |
| Hematocrit (%) | 40 ± 5 | 41 ± 5 | 0.640 |
| White blood cell (/µL) | 6,624 ± 1,492 | 6,884 ± 1,484 | 0.102 |
| Platelet count (×104/µL) | 21 ± 5 | 22 ± 5 | 0.463 |
| Total cholesterol (mg/dL) | 222 ± 39 | 223 ± 44 | 0.938 |
| LDL cholesterol (mg/dL) | 143 ± 35 | 147 ± 42 | 0.384 |
| Triglyceride (mg/dL) | 125 ± 66 | 125 ± 64 | 0.509 |
| HDL cholesterol (mg/dL) | 52 ± 13 | 50 ± 13 | 0.146 |
| FBG (mg/dL) | 113 ± 27 | 121 ± 27 | < 0.05 |
| Log-hs-CRP (mg/dL) | -1.3 ± 0.6 | -1.1 ± 0.5 | < 0.001 |
| CAVI | 9.0 ± 1.2 | 9.9 ± 1.1 | < 0.001 |
| RAS inhibitor, n (%) | 393 (38) | 25 (26) | < 0.05 |
| Statin, n (%) | 318 (31) | 17 (18) | < 0.01 |
| Anti-diabetic drug, n (%) | 210 (20) | 26 (27) | 0.100 |
| HR | 95% CI | P value | |
|---|---|---|---|
| HR: hazard ratio; CI: confidence interval; CAVI: cardio-ankle vascular index; hs-CRP: high sensitivity C reactive protein; RAS: renin-angiotensin system; SBP: systolic blood pressure. | |||
| CAVI (> 9) | 2.52 | 1.35 - 3.53 | < 0.01 |
| Group H (vs. group L) | 2.32 | 1.31 - 3.20 | < 0.01 |
| Sex (male) | 2.05 | 1.30 - 3.13 | < 0.01 |
| Age (≥ 65 yrs) | 1.87 | 1.15 - 3.07 | < 0.01 |
| Diabetes mellitus | 1.69 | 1.11 - 2.57 | < 0.05 |
| hs-CRP (≥ 0.1mg/dL) | 1.45 | 1.04 - 2.22 | < 0.05 |
| Statin | 0.67 | 0.33 - 0.92 | < 0.05 |
| Current smoker | 1.38 | 0.98 - 2.01 | 0.065 |
| RAS inhibitor | 0.66 | 0.42 - 1.04 | 0.073 |
| SBP (≥ 140mm Hg) | 1.23 | 0.80 - 1.91 | 0.339 |