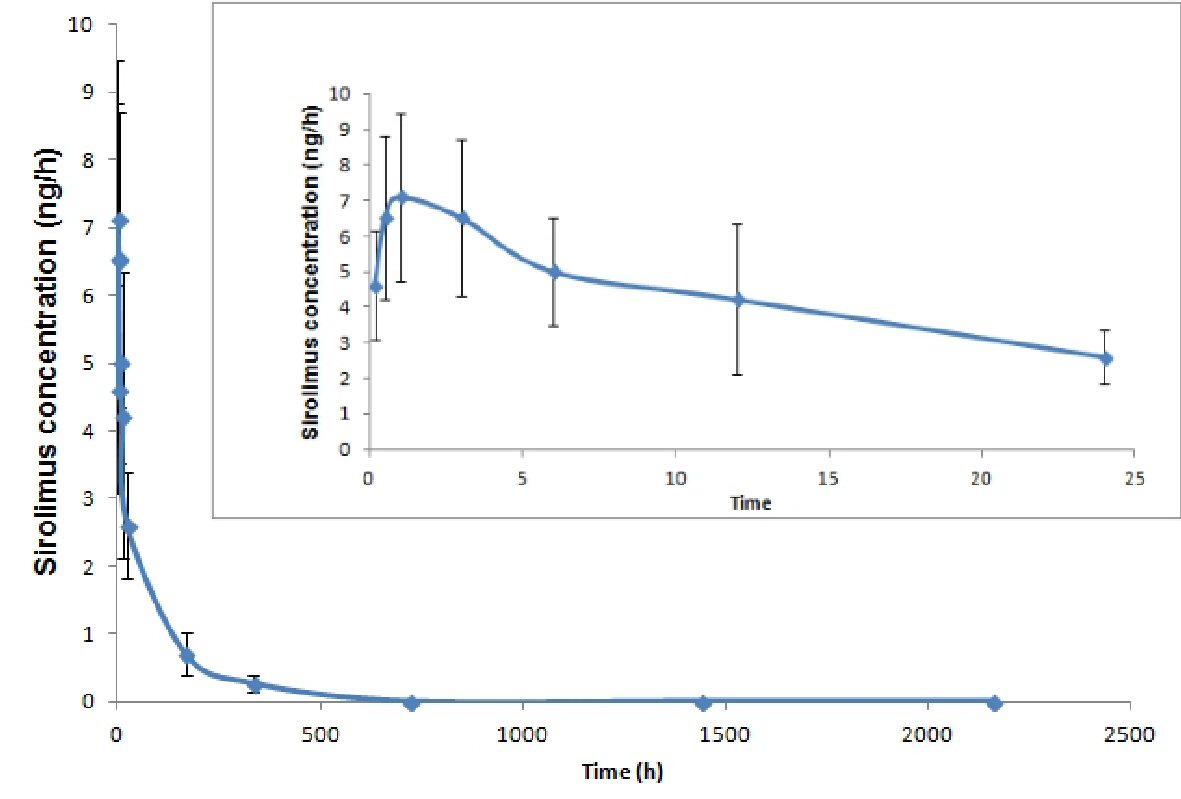
Figure 1. Pharmacokinetic profiles (concentration versus time profile) of sirolimus over 90 days after implantation of sirolimus-eluting MeRes100 BRS.
| Cardiology Research, ISSN 1923-2829 print, 1923-2837 online, Open Access |
| Article copyright, the authors; Journal compilation copyright, Cardiol Res and Elmer Press Inc |
| Journal website http://www.cardiologyres.org |
Original Article
Volume 9, Number 6, December 2018, pages 364-369
Pharmacokinetic Study of Sirolimus-Eluting BioResorbable Vascular Scaffold System for Treatment of De Novo Native Coronary Lesions: A Sub-Study of MeRes-1 Trial
Figure
Tables
| LVEF: left ventricular ejection fraction. | |
| Patient characteristic | N = 10 Subjects |
| Age (mean ± SD) , years | 49.07 ± 8.95 |
| Gender, n (%) | |
| Male | 7 (70%) |
| Female | 3 (30%) |
| BMI (mean ± SD) | 25.05 ± 3.91 |
| Smokers, n (%) | 2 (20%) |
| Diabetes mellitus, n (%) | 4 (40%) |
| Hypertension, n (%) | 3 (30%) |
| Other illness, n (%) | 1 (10%) |
| Previous myocardial infarction, n (%) | 3 (30%) |
| Clinical presentation, n (%) | |
| Stable angina | 5 (50%) |
| Unstable angina | 5 (50%) |
| LVEF, (mean ± SD) | 59.5 ± 3.02 |
| Diseased vessel, n (%) | |
| Single vessel | 7 (70%) |
| Double vessel | 3 (30%) |
| Total number of lesions | 13 |
| Total number of treatable lesions | 12 |
| Lesion per patient | 1.2 |
| Size of MeRes100 BRS (diameter × length, mm) | Loading dose ±10% (µg) | Subject ID |
|---|---|---|
| †Subject ID 5 and 22 were received two BRS. | ||
| 3.5 × 19 | 247 | 1, 2 |
| 3.0 × 24 | 238 | 3, 7, 18, 20 |
| 3.0 × 24, 2.75 × 24 | 238, 229 (467) | 5† |
| 3.0 × 19, 2.75 × 19 | 189, 184 (373) | 22† |
| 3.5 × 24 | 306 | 19, 21 |
| ID no. | No. of stents | Tmax (h) | Cmax (ng/mL) | t1/2 (h) | AUC0-t (h·ng/mL) | AUC0-∞ (h·ng/mL) | AUC_%Extrap_obs (%) | Kel (h-1) | CL (L/h) | Vd (L) |
|---|---|---|---|---|---|---|---|---|---|---|
| Tmax: time to reach peak concentration; Cmax: peak concentration; t1/2: half-life; AUC: area under the concentration time curve; kel: elimination rate constant; CL: clearance; Vd: volume of distribution. | ||||||||||
| 1 | 1 | 1.00 | 7.38 | 119.16 | 433.91 | 494.14 | 12.19 | 0.006 | 0.50 | 85.93 |
| 2 | 1 | 1.00 | 4.30 | 74.63 | 343.33 | 363.01 | 5.42 | 0.009 | 0.68 | 73.26 |
| 3 | 1 | 3.00 | 5.46 | 87.59 | 292.79 | 317.99 | 7.92 | 0.008 | 0.75 | 94.58 |
| 7 | 1 | 1.00 | 4.98 | 76.31 | 243.48 | 258.32 | 5.75 | 0.009 | 0.92 | 101.44 |
| 18 | 1 | 1.00 | 9.58 | 77.04 | 402.37 | 419.77 | 4.14 | 0.009 | 0.57 | 63.02 |
| 19 | 1 | 1.00 | 10.20 | 185.34 | 777.05 | 814.17 | 4.56 | 0.004 | 0.38 | 100.50 |
| 20 | 1 | 0.50 | 9.48 | 79.98 | 325.95 | 341.70 | 4.61 | 0.009 | 0.70 | 80.37 |
| 21 | 1 | 3.00 | 3.88 | 85.92 | 334.82 | 356.63 | 6.12 | 0.008 | 0.86 | 106.35 |
| 5 | 2 | 0.50 | 8.72 | 104.08 | 622.30 | 691.86 | 10.05 | 0.007 | 0.67 | 101.35 |
| 22 | 2 | 3.00 | 10.71 | 95.84 | 588.54 | 635.75 | 7.43 | 0.007 | 0.59 | 81.12 |
| 1 BRS | ||||||||||
| Mean | 1.438 | 6.906 | 98.247 | 394.214 | 420.717 | 6.339 | 0.0077 | 0.668 | 88.181 | |
| SD | 0.9797 | 2.5806 | 38.0034 | 165.6125 | 173.5344 | 2.6439 | 0.00194 | 0.182 | 15.215 | |
| SEM | 0.3464 | 0.9122 | 13.4367 | 58.5525 | 61.3543 | 0.9351 | 0.0006 | 0.0639 | 5.3792 | |
| N | 8 | 8 | 8 | 8 | 8 | 8 | 8 | 8 | 8 | |
| 2 BRS | ||||||||||
| Mean | 1.750 | 9.715 | 99.959 | 605.419 | 663.805 | 8.740 | 0.0069 | 0.631 | 91.237 | |
| SD | 1.7678 | 1.4072 | 5.8269 | 23.8675 | 39.6725 | 1.8586 | 0.00040 | 0.062 | 14.306 | |
| SEM | 1.2500 | 0.9950 | 4.1200 | 16.8800 | 28.0550 | 1.3100 | 0.0000 | 0.0400 | 10.1150 | |
| N | 2 | 2 | 2 | 2 | 2 | 2 | 2 | 2 | 2 | |
| All patients | ||||||||||
| Mean | 1.500 | 7.468 | 98.589 | 436.455 | 469.334 | 6.819 | 0.0075 | 0.661 | 88.792 | |
| SD | 1.0541 | 2.6082 | 33.5798 | 171.2486 | 184.6681 | 2.6165 | 0.00175 | 0.1625 | 14.2984 | |
| SEM | 0.3333 | 0.8245 | 10.6189 | 54.1536 | 58.3972 | 0.8274 | 0.0006 | 0.0514 | 4.5216 | |
| N | 10 | 10 | 10 | 10 | 10 | 10 | 10 | 10 | 10 | |