Cardiology Research, ISSN 1923-2829 print, 1923-2837 online, Open Access
Article copyright, the authors; Journal compilation copyright, Cardiol Res and Elmer Press Inc
Journal website http://www.cardiologyres.org

Original Article

Volume 10, Number 2, April 2019, pages 98-105


Rate Control Yields Better Clinical Outcomes Over a Median Follow-Up of 20 Months Compared to Rhythm Control Strategy in Patients With a History of Atrial Fibrillation: A Retrospective Cohort Study

Figures

Figure 1.
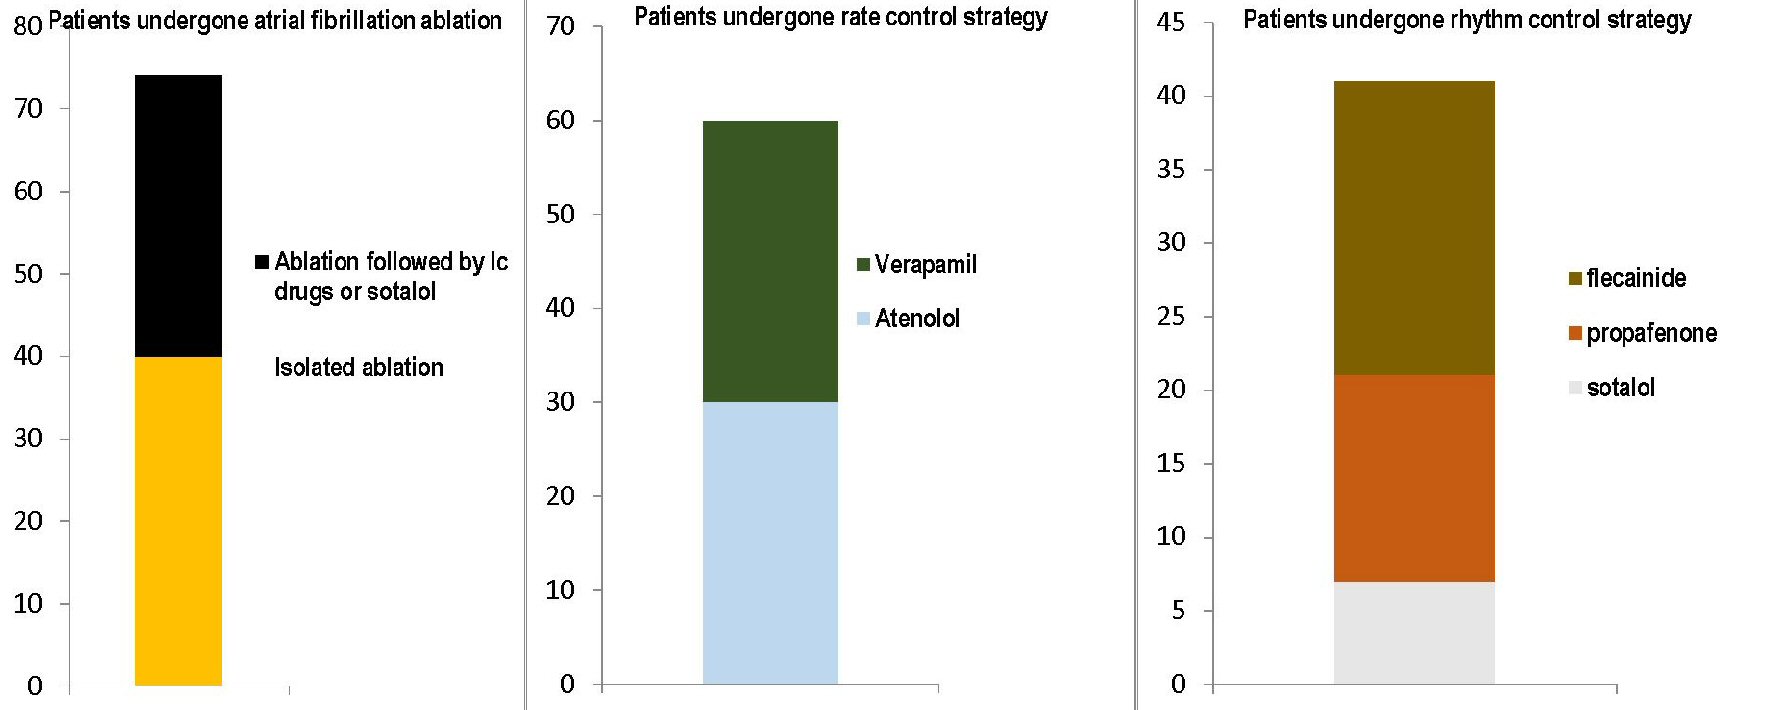
Figure 1. The figure shows the respective distributions of the three therapeutic approaches used in the series of 175 patients included in the present cohort retrospective study. The three graphs with stacked layers refer each to one of the three therapeutic modalities adopted: on the left, the transcatheter ablation, involving 74 patients, of whom 40 subjected to simple ablation and 34 with ablation followed by chronic administration of antiarrhythmics, namely IC drugs or sotalol; at the center, the rate control strategy with the use of atenolol (30 cases) or verapamil (30 cases); on the right the rhythm control strategy, with the bar consisting of three layers representing the use of sotalol (seven cases), propafenone (14 cases) and flecainide (20 cases), respectively.
Figure 2.
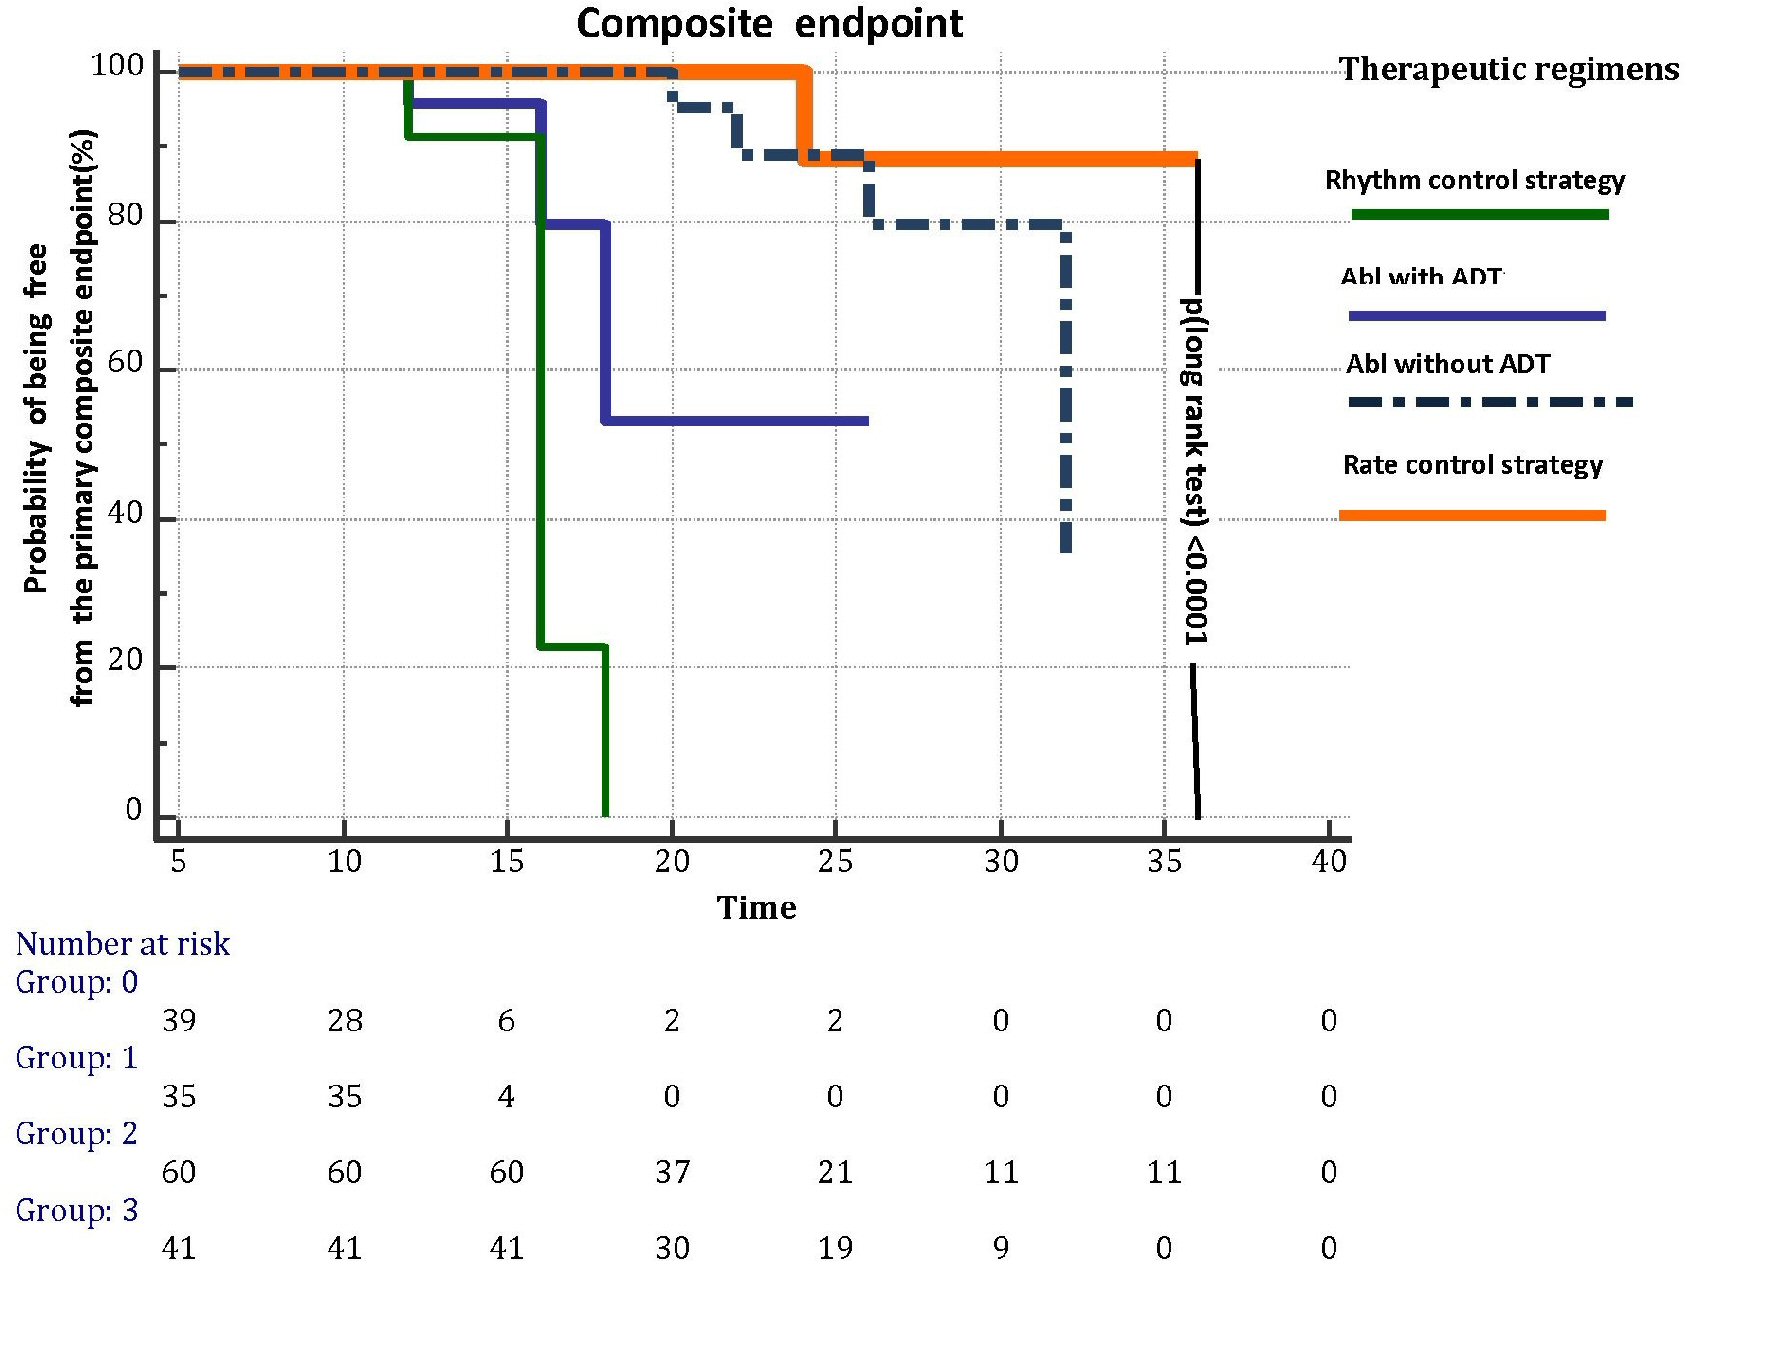
Figure 2. Kaplan-Meier curves illustrating the effects on primary composite endpoint, i.e., death, disabling stroke, major bleeding and cardiac arrest, exerted by each of the four therapeutic regimens for AF prevention (rhythm control strategy, abl with ADT, abl without ADT and rate control strategy) investigated in the retrospective study through a median follow-up of 20 months. Abl: transcatheter ablation; AF: atrial fibrillation; ADT: antiarrhythmic drug treatment.
Figure 3.
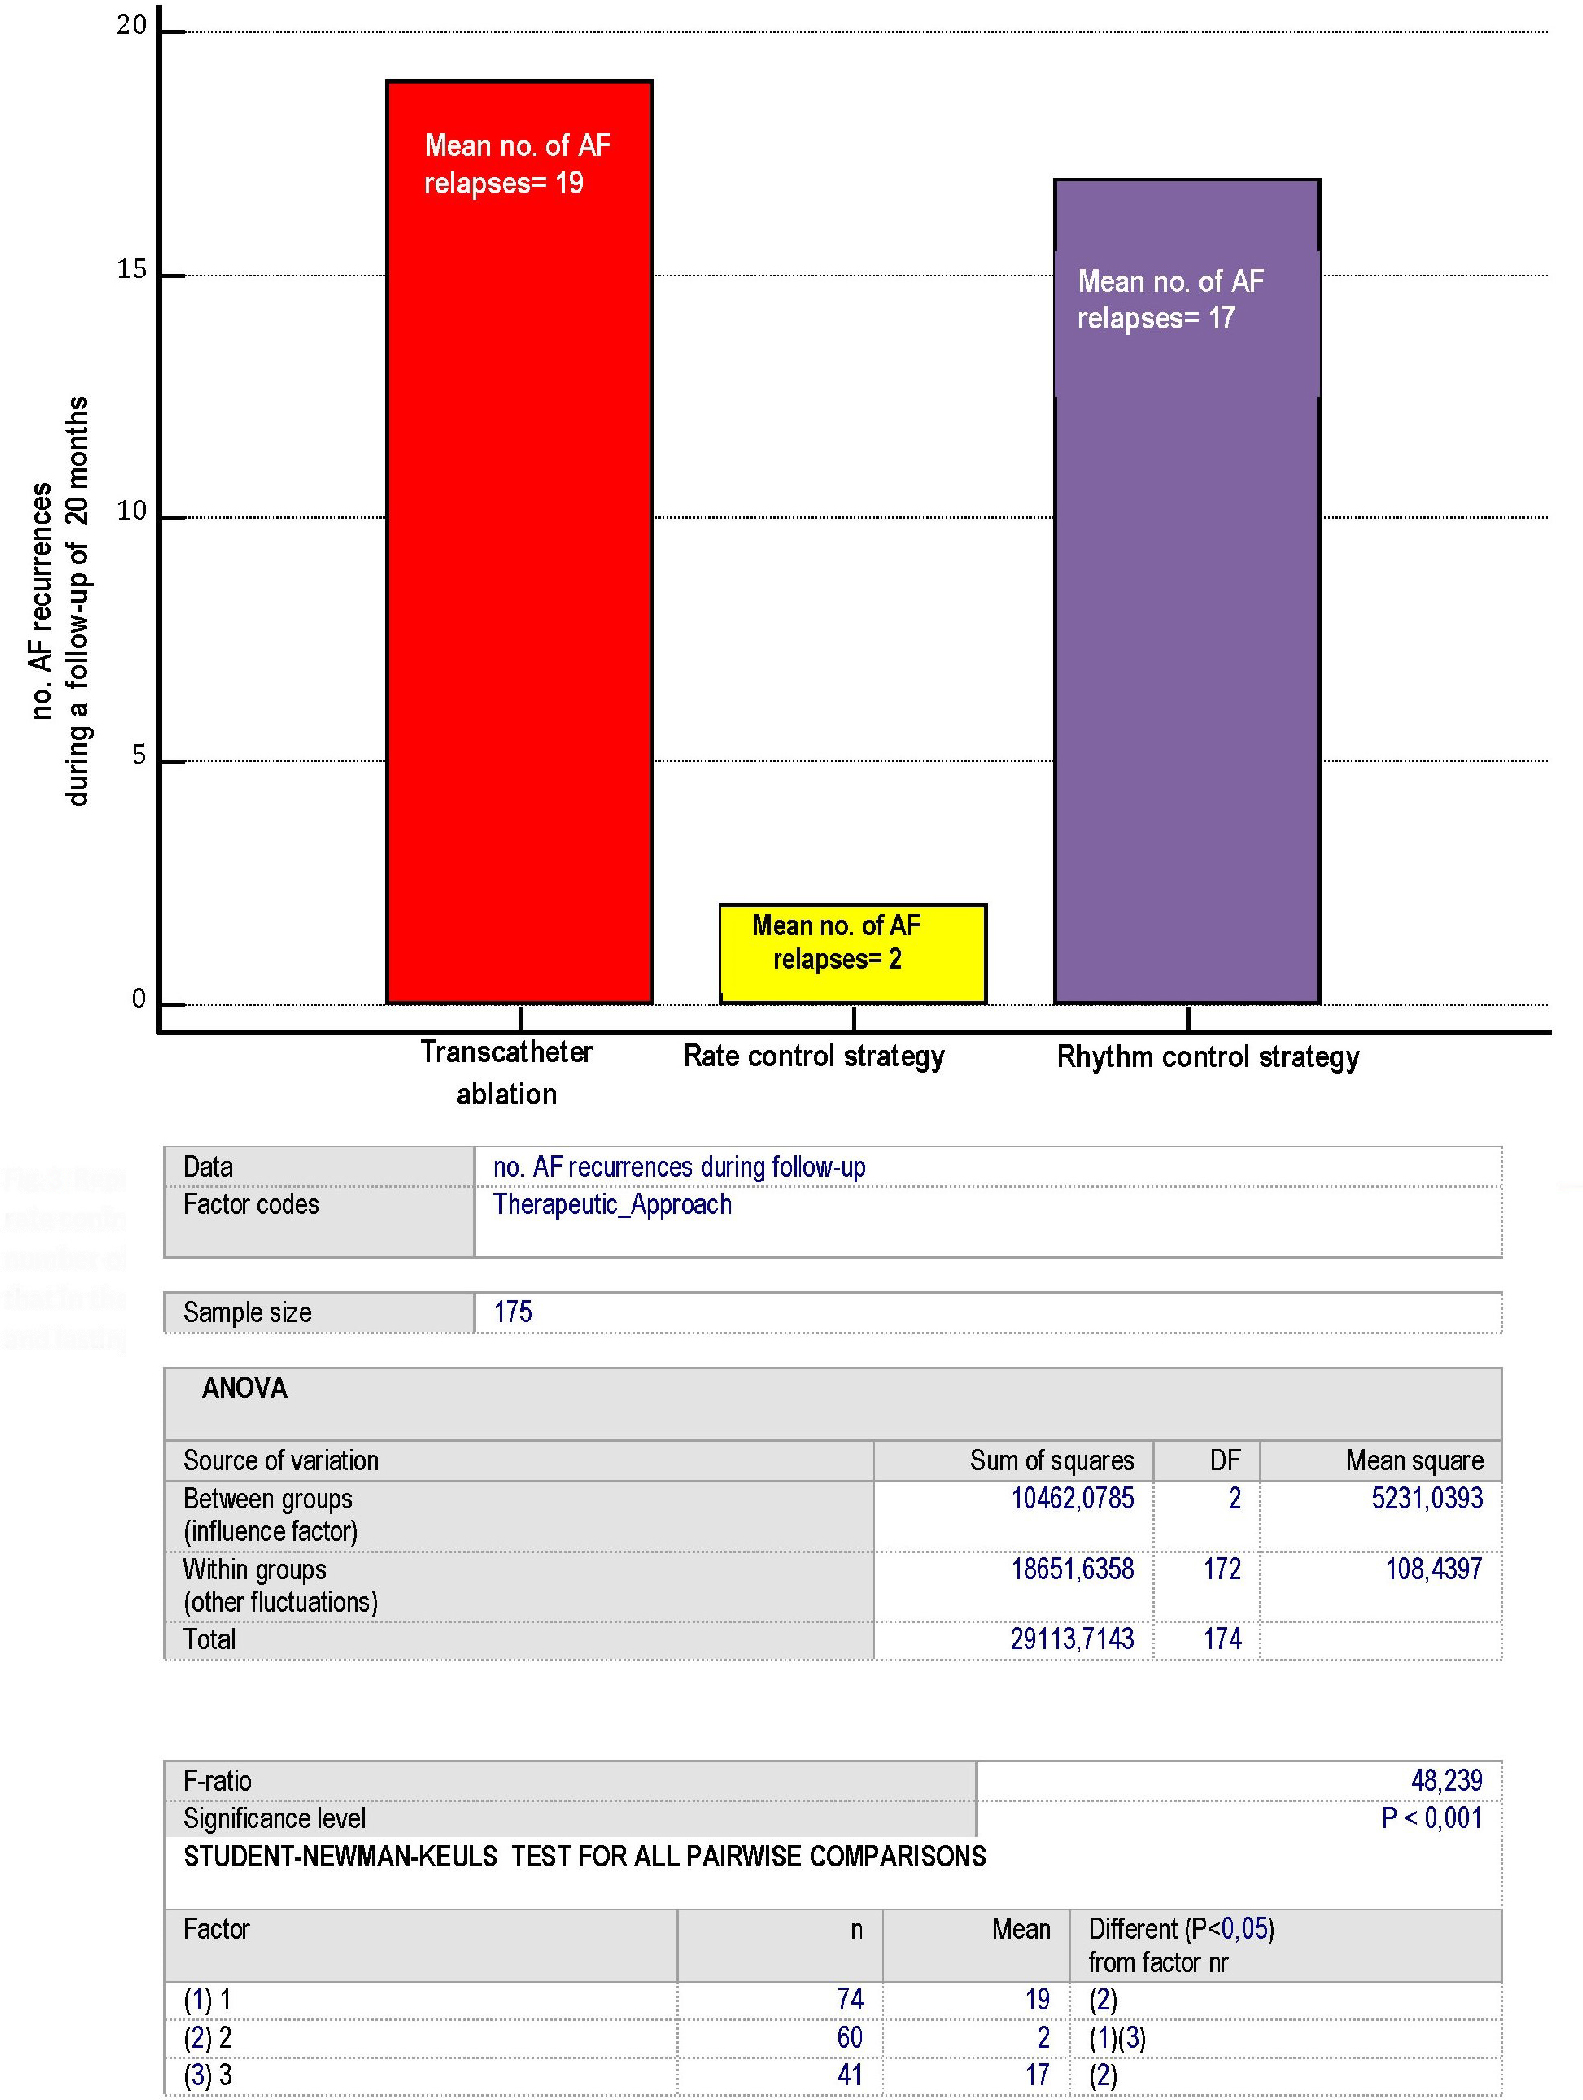
Figure 3. Representation of the AF recurrences, according to the type of therapeutic approach: whether consisting of ablation, rate control or rhythm control strategy. Please note that each of the numbers reported within the bars coincides with the mean number of AF recurrences identified for every patient of the three arms over a 20- month median follow-up. Moreover, note that in the rate control strategy group any rise in mean ventricular response occurring at rest attaining 140 beats per minute and lasting no less than 30 min was arbitrarily equated to an AF relapse. AF: atrial fibrillation.

Tables

Table 1. Clinical Characteristics
 
Therapeutic regimenCatheter ablation (n  =  74)Rate control strategy (n  =  60)Rhythm control strategy (n  =  41)
AF: atrial fibrillation; BMI: body mass index; IQR: interquartile range; SD: standard deviation; TIA: transient ischemic attack.
Age (years), median (IQR)62 (54 - 70)63 (56 - 63)63 (55 - 64)
Male gender, n (%)53 (72%)44 (74%)27 (65.8%)
BMI (kg/m2), mean ± SD27.3 ± 427.3 ± 429 ± 5
Paroxysmal AF, n (%)74 (100%)47 (78.3%)32 (78%)
Prior cardioversion, n (%)18 (24%)14 (23.3%)25 (60.9%)
AF history (months), median (IQR)26 (12 - 81)26 (7 - 84)26 (12–81)
Antero-posterior left atrial diameter (mm), mean ± SD42 ± 443 ± 543 ± 6
Hypertension, n (%)33 (44.6 %)27 (45%)17 (41.5%)
Left ventricular ejection fraction (%)565052
Previous TIA/stroke, n (%)6 (8%)5 (8%)5 (12.2%)
Diabetes, n (%)3 (4.05%)3 (5%)3 (7.3%)
History of typical atrial flutter, n (%)16 (21.62%)7 (11.6 %)8 (19.5%)
CHA2DS2-VASc score > 2, n (%)15 (20.2%)12 (20%)9 (21.95%)
At least 1 AF episode, n (%)
  Per 3 months17 (22.9 %)23 (38.3 %)9 (21.95%)
  Per month17 (23%)22 (36.6 %)8 (19.5%)
  Per week12 (16.2%)15 (25%)5 (12.2%)
  Per day5 (6.7%)9 (15%)3 (7.3%)


Table 3. Multivariable Cox Proportional-Hazards Regression Model
 
CovariatebSEPHazard ratio (HR)95% CI of HR
*Indicating the variable has a significant meaning of protective factor (rate control strategy), or vice versa, that it is a predictor of increased risk (No. of AF recurrences during the follow-up, rhythm control strategy, and hypertension) with regard to composite of death, disabling stroke, severe bleeding and cardiac arrest. Catheter ablation is not a predictor of improved clinical outcomes in the mid-term (median follow-up: 20 months), in spite of its efficacy in suppressing atrial tachyarrhythmias. b: regression coefficient; SE: standard error of b; AF: atrial fibrillation; CI: confidence interval; IC drugs: antiarrhythmic drugs belonging to class IC of the Vaughan-Williams classification; LVEF: left ventricular ejection fraction.
No. AF recurrences during follow-up0.04380.02140.0410*1.0448*1.0020 to 1.0895*
Time to first AF recurrence (days)0.00160.00170.36421.00160.9982 to 1. 0051
Catheter ablation (0 = isolated ablation; 1 = ablation followed by IC drugs or sotalol)11.1241185.69590.15221.00150.9983 to 1.0046
Rate control strategy (2 = atenolol; 3 = verapamil)-2.64330.85100.0019*0.0711*0.0135 to 0.3738*
Rhythm control strategy (4 = sotalol; 5 = propafenone; 6 = flecainide)1.19870.39280.0023*3.3159*1.5415 to 7.1329*
Antero-posterior left atrial diameter-0.25670.28420.36630.77360.4445 to 1.3464
LVEF (%)0.05420.06770.42391.05570.9250 to 1.2049
Hypertension2.26291.14280.0477*1.1040*1.0112 to 1.9662*


Table 2. Distribution of the Four Components of the Primary Composite Endpoint Among the Four Therapeutic Regimens for Prevention of AF Recurrences
 
DeathDisabling strokeMajor bleedingCardiac arrest
Abl: transcatheter ablation; ADT: antiarrhythmic drug treatment; AF: atrial fibrillation.
Abl without ADT3--1
Abl with ADT4--2
Rate control strategy211-
Rhythm control strategy4313