Cardiology Research, ISSN 1923-2829 print, 1923-2837 online, Open Access
Article copyright, the authors; Journal compilation copyright, Cardiol Res and Elmer Press Inc
Journal website http://www.cardiologyres.org

Original Article

Volume 10, Number 2, April 2019, pages 83-88


Assessment of Mitral Annular Plane Systolic Excursion in Patients With Left Ventricular Diastolic Dysfunction

Figures

Figure 1.
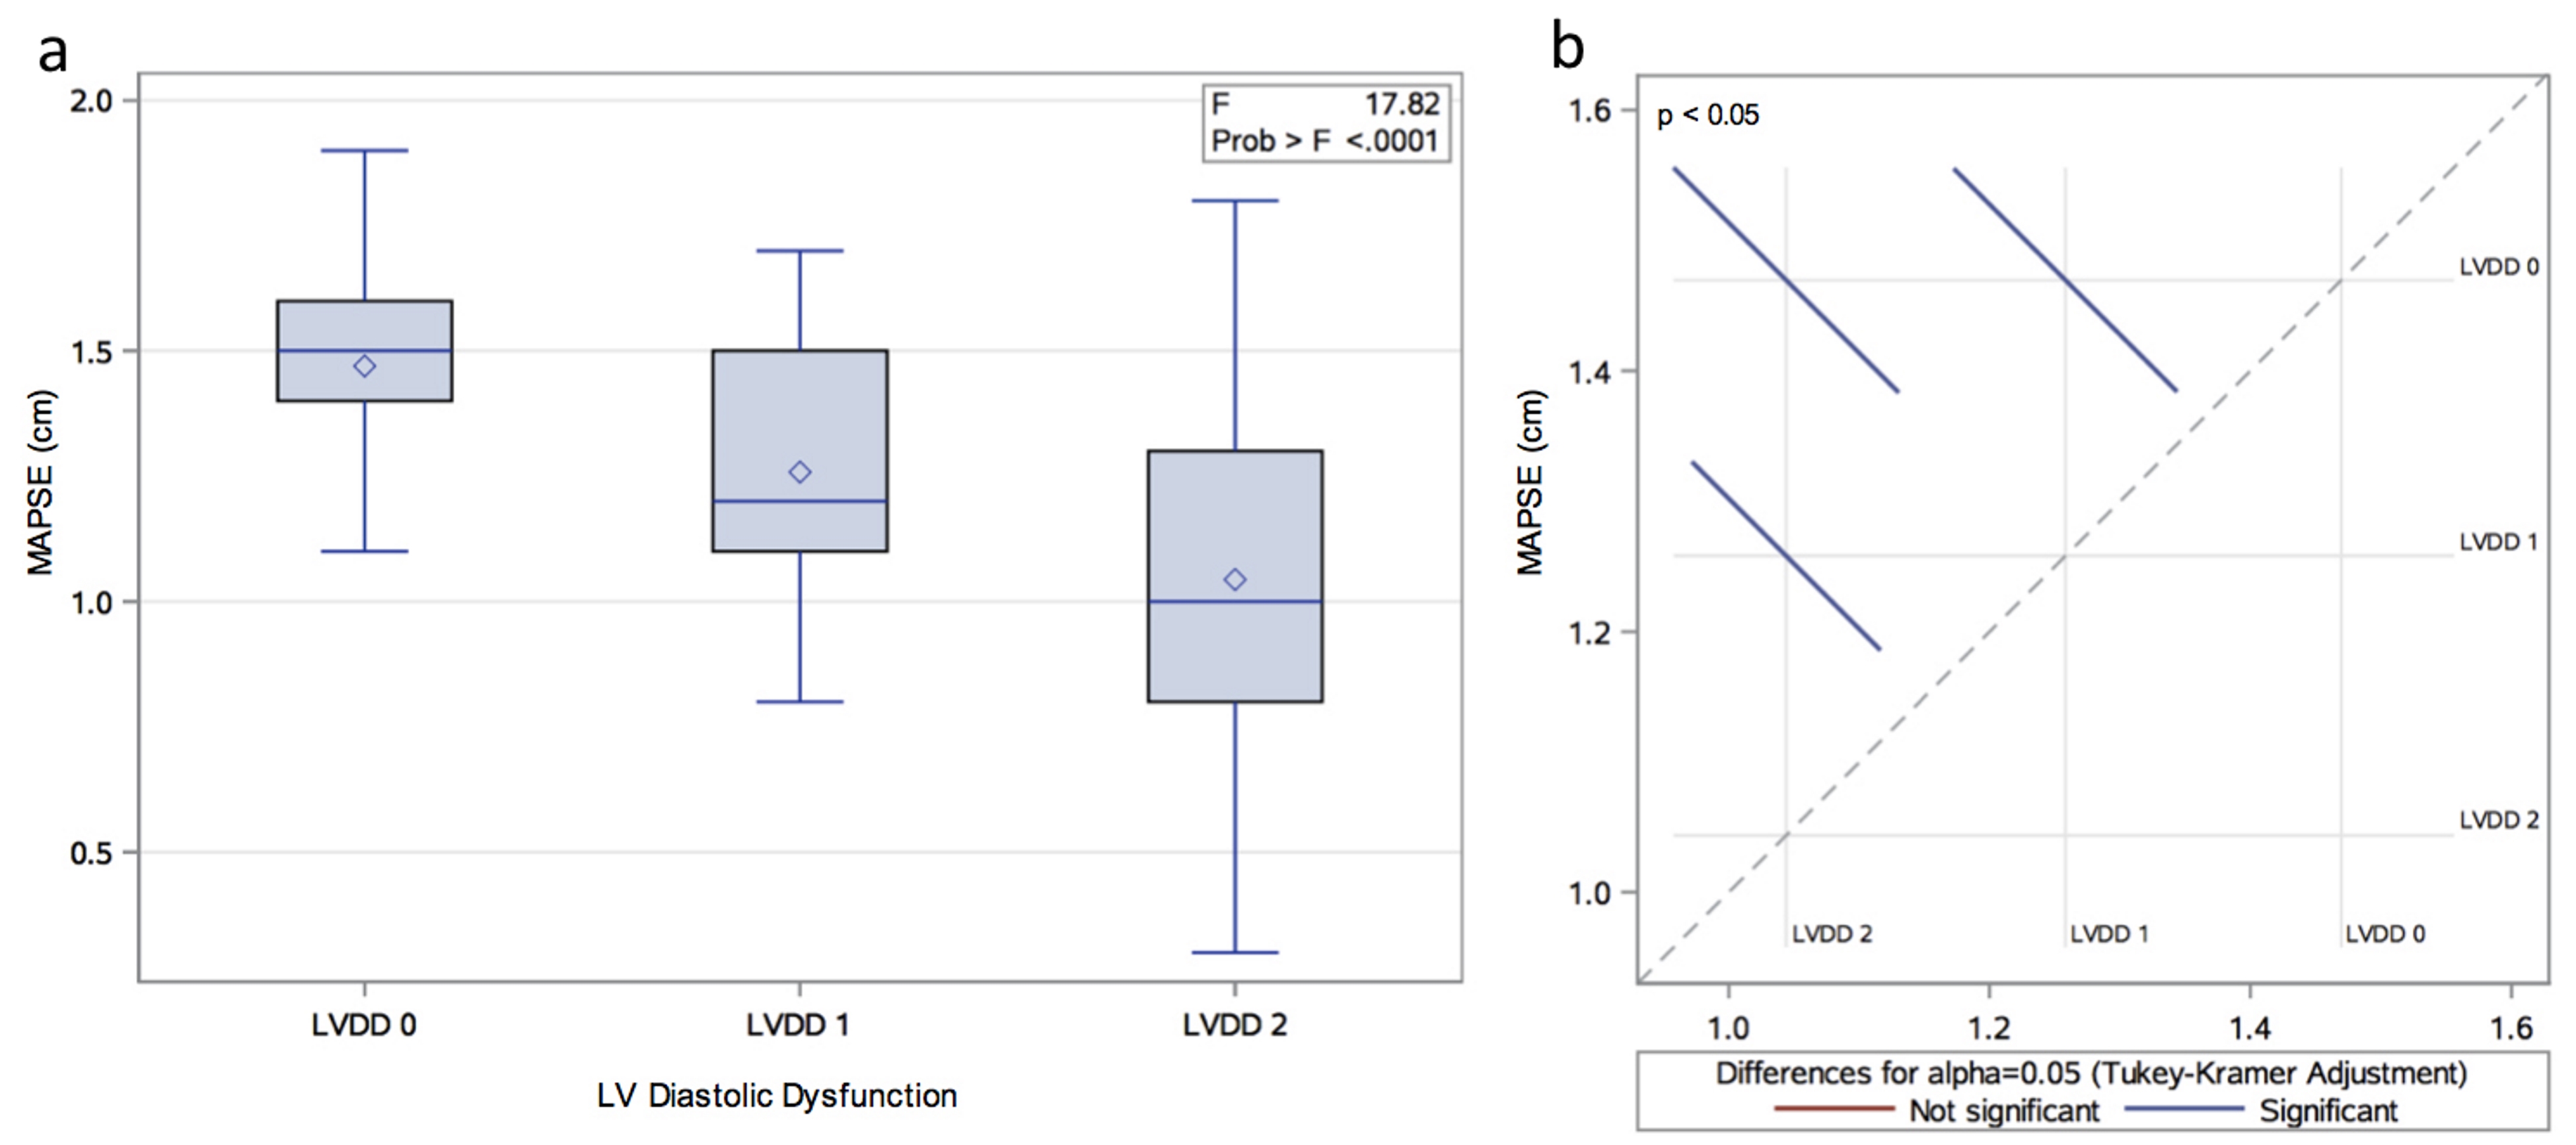
Figure 1. (a) Distribution of MAPSE by LVDD group. (b) Least square means adjustment for multiple comparisons using Bonferroni correction. The graphic shows significant differences between all the possible group pairs (LVDD 0 vs. 1; LVDD 0 vs. 2; LVDD 1 vs. 2).
Figure 2.
Figure 2. Model diagnostics analysis. (a) Q-Q plot for normality analysis of residuals showing a normal distribution. (b) Observed versus fitted MAPSE showing a good visual correlation. Q-Q: quantile-quantile.
Figure 3.
Figure 3. Contour fit plot for MAPSE by age and left ventricular ejection fraction.

Tables

Table 1. Demographic and Echocardiographic Data of the Study Population
 
VariablesLVDD 0, (n = 23)LVDD 1, (n = 43)LVDD 2, (n = 41)P value
SD: standard deviation; BSA: body surface area; TDI: tissue Doppler imaging; MV: mitral valve; MA: mitral annulus; LV: left ventricle; LVEF: LV ejection fraction; LVESV: LV end systolic volume; LVEDV: LV end diastolic volume; MAPSE: mitral annular plane systolic excursion; LAVI: left atrial volume index; LVMI: LV mass index; DT: deceleration time. aLVDD 2 is different from LVDD 1 and LVDD 0 (P < 0.05); bLVDD 0 is different from LVDD 1 and LVDD 2 (P < 0.05); cLVDD 1 is different from LVDD 0 and LVDD 2 (P < 0.05); dLVDD 1 is different from LVDD 2 (P < 0.05).
Categorical, men, n (%)12 (52)22 (51)21 (51)0.90
Continuous, ± SD
  Age (years)42 ± 12b58 ± 1255 ± 13< 0.01
  BSA (m2)1.9 ± 0.32.0 ± 0.32.0 ± 0.30.34
  LVEF (%)69 ± 671 ± 1355 ± 22a< 0.01
  LVESV (mL)36 ± 1332 ± 2277 ± 60a< 0.01
  LVEDV (mL)115 ± 32105 ± 35152 ± 62a< 0.01
  MAPSE (cm)1.5 ± 0.2b1.3 ± 0.2c1.0 ± 0.4a< 0.01
  LAVI (mL/m2)23 ± 827 ± 935 ± 15a< 0.01
  LVMI (g/m2)75 ± 20b106 ± 33c126 ± 46a< 0.01
  MV DT (ms)174 ± 38195 ± 47d164 ± 52< 0.01
  MV E (cm/s)82 ± 2772 ± 22102 ± 30a< 0.01
  MV A (cm/s)59 ± 2694 ± 32c65 ± 31< 0.01
  MV E/A ratio1.5 ± 0.70.8 ± 0.2c2.0 ± 1.6< 0.01
  MA E’ (cm/s)14 ± 3b8 ± 2c6 ± 2a< 0.01
  MA A’ (cm/s)8 ± 210 ± 3c7 ± 3< 0.01
  MA TDI E’/A’ ratio1.9 ± 0.7b0.9 ± 0.41.0 ± 0.5< 0.01
  MV E/MA TDI E’ ratio6.2 ± 2.39.4 ± 3.517.9 ± 8.7a< 0.01


Table 2. Simple Linear Regression Analysis Between Evaluated Variables and MAPSE
 
Independent variablesCoefficientT value95% Confidence limitsP value
BSA: body surface area; TDI: tissue Doppler imaging; MV: mitral valve; MA: mitral annulus; LV: left ventricle; LVEF: LV ejection fraction; LVESV: LV end systolic volume; LVEDV: LV end diastolic volume; MAPSE: mitral annular plane systolic excursion; LAVI: left atrial volume index; LVMI: LV mass index; DT: deceleration time.
Men0.05300.86-0.0700 to 0.17580.39
Age (years)-0.0066-3.07-0.0109 to -0.0023< 0.01
BSA (m2)0.07480.74-0.1265 to 0.27610.46
LVDD-0.3160-4.58-0.4529 to -0.1791< 0.01
LVEF (%)0.01087.530.0080 to 0.0137< 0.01
LVESV (mL)-0.0039-6.71-0.0050 to -0.0027< 0.01
LVEDV (mL)-0.0015-2.50-0.0027 to -0.00030.01
LAVI (mL/m2)-0.0049-2.05-0.0097 to -0.00020.04
LVMI (g/m2)-0.0003-5.11-0.0048 to -0.0021< 0.01
MV DT (ms)0.00213.450.0009 to 0.0033< 0.01
MV E (cm/s)0.00030.32-0.0018 to 0.00240.75
MV A (cm/s)0.00232.520.0005 to 0.00400.01
MV E/A ratio-0.0902-3.55-0.1405 to -0.0400< 0.01
MA E’ (cm/s)0.04636.470.0321 to 0.0605< 0.01
MA A’ (cm/s)0.03353.620.0151 to 0.0518< 0.01
MA TDI E’/A’ ratio0.07161.52-0.0216 to 0.16480.13
MV E / MA TDI E’ ratio-0.0199-5.53-0.0271 to -0.0128< 0.01


Table 3. Stepwise Multiple Regression Analysis to Determine the Best Predictors of MAPSE
 
Independent variablesCoefficientT95% Confidence limitsP valueR square
TDI: tissue Doppler imaging; MV: mitral valve; MA: mitral annulus; LV: left ventricle; LVDD: LV diastolic dysfunction; LVEF: LV ejection fraction; LAVI: left atrial volume index; LVMI: LV mass index.
Age (years)-0.0067-3.76-0.0102 to -0.0032< 0.010.5570
LVDD-0.0742-1.13-0.2041 to 0.05570.26
LVEF (%)0.00936.630.0065 to 0.0121< 0.01
LAVI (mL/m2)0.00381.93-0.0001 to 0.00760.06
LVMI (g/m2)-0.0020-3.07-0.0032 to -0.0007< 0.01
MV E/MA TDI E’ ratio-0.0045-1.20-0.0120 to -0.0030< 0.01