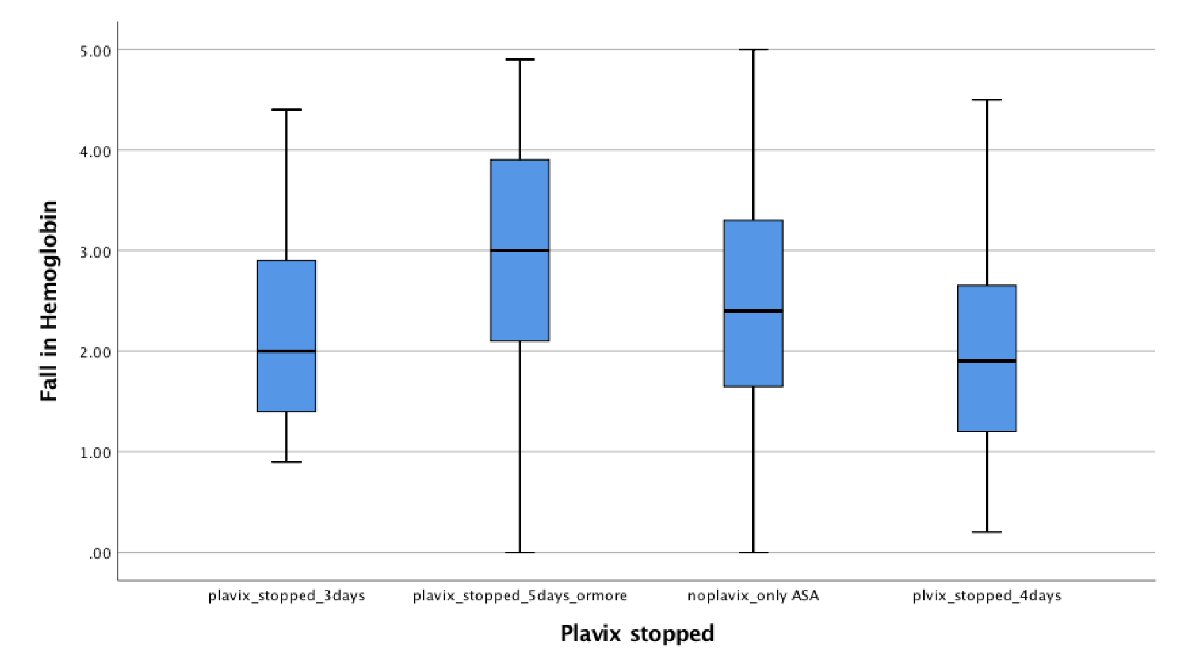
Figure 1. Test of variance. There were no outliers in the data, as assessed by inspection of a boxplot for values greater than 1.5 box-lengths from the edge of the box.
| Cardiology Research, ISSN 1923-2829 print, 1923-2837 online, Open Access |
| Article copyright, the authors; Journal compilation copyright, Cardiol Res and Elmer Press Inc |
| Journal website http://www.cardiologyres.org |
Original Article
Volume 10, Number 2, April 2019, pages 74-82
Optimal Duration for Clopidogrel Suspension Prior to Coronary Artery Bypass Grafting
Figures
Tables
| Group (clopidogrel stopped) | Total number | Sex (male) | Average LVEF | Age (mean) | HTN | DM | CHF | HLD | Smoking | PRBC |
|---|---|---|---|---|---|---|---|---|---|---|
| HTN: hypertension; DM: diabetes mellitus; CHF: congestive heart failure; HLD: hyperlipidemia; PRBC: packed red blood cells. | ||||||||||
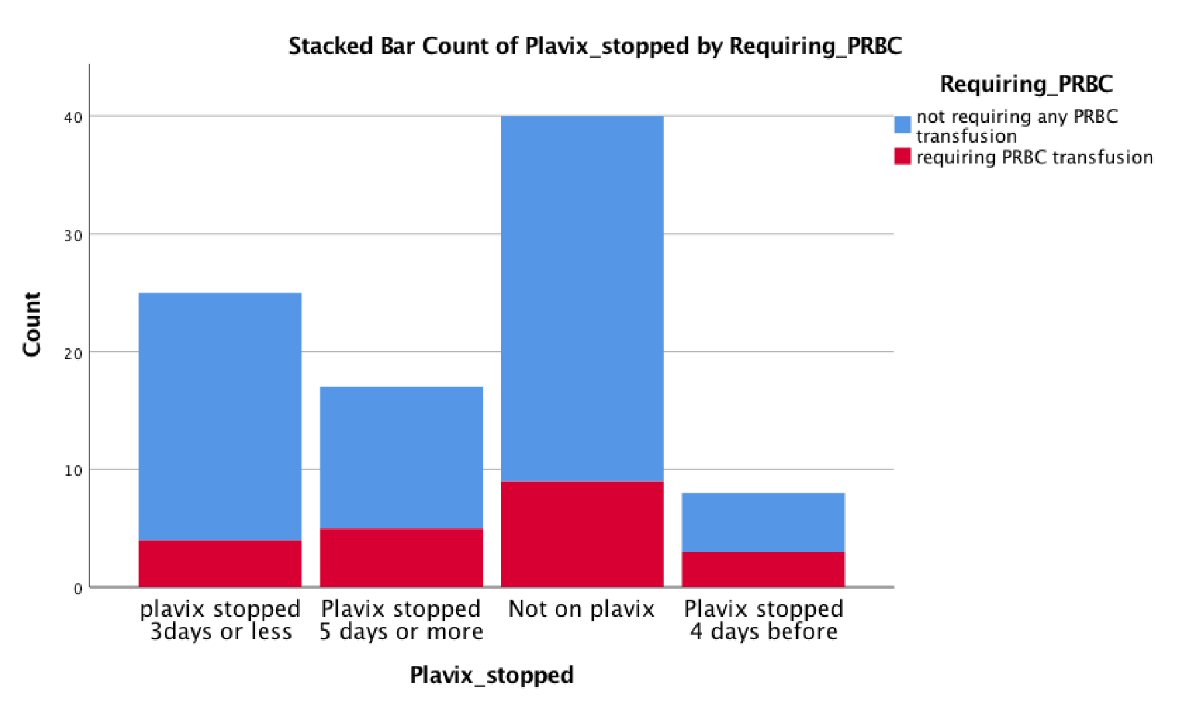
| 3 days or less | 25 | 22 (88%) | 45% | 67 | 25 (100%) | 14 (56%) | 1 (4%) | 20 (80%) | 10 (40%) | 4 (16%) |
| 5 days | 17 | 8 (47%) | 46% | 76 | 17 (100%) | 9 (53%) | 2 (11%) | 16 (94%) | 3 (18%) | 5 (29%) |
| Not on clopidogrel | 40 | 31 (78%) | 44% | 68 | 34 (85%) | 21 (53%) | 1 (3%) | 26 (65%) | 7 (18%) | 9 (23%) |
| 4 days | 8 | 4 (50%) | 45% | 72 | 8 (100%) | 5 (63%) | 1 (13%) | 5 (63%) | 2 (25%) | 3 (38%) |
| Total | 90 | 65 (72%) | 45% | 71 | 72 (80%) | 49 (54%) | 5 (6%) | 67 (74%) | 22 (24%) | 21 (23%) |
| Frequency | Percent | Valid percent | Cumulative percent | |
|---|---|---|---|---|
| Clopidogrel stopped 3 days or less | 25 | 27.8 | 27.8 | 27.8 |
| Clopidogrel stopped 5 days | 17 | 18.9 | 18.9 | 46.7 |
| Not on clopidogrel | 40 | 44.4 | 44.4 | 91.1 |
| Clopidogrel stopped 4 days before | 8 | 8.9 | 8.9 | 100.0 |
| Total | 90 | 100.0 | 100.0 |
| Clopidogrel stopped | Kolmogorov-Smirnov | Shapiro-Wilk | ||||
|---|---|---|---|---|---|---|
| Statistic | df | Sig. | Statistic | df | Sig. | |
| The fall in hemoglobin was normally distributed for all the groups, as assessed by Shapiro-Wilk’s test (P > 0.05) | ||||||
| Clopidogrel stopped 3 days | 0.188 | 25 | 0.02 | 0.885 | 25 | 0.09 |
| Clopidogrel stopped 5 days | 0.094 | 17 | 0.20 | 0.972 | 17 | 0.855 |
| No clopidogrel | 0.066 | 40 | 0.20 | 0.973 | 40 | 0.435 |
| Clopidogrel stopped 4 days | 0.178 | 8 | 0.20 | 0.962 | 8 | 0.832 |
| Levene statistic | df1 | df2 | Sig. | |
|---|---|---|---|---|
| There was homogeneity of variances, as assessed by Levene’s test for equality of variances (P > 0.05). | ||||
| Based on mean | 0.214 | 3 | 86 | 0.886 |
| Based on median | 0.314 | 3 | 86 | 0.815 |
| Based on median and with adjusted df | 0.314 | 3 | 84.115 | 0.815 |
| Based on trimmed mean | 0.268 | 3 | 86 | 0.848 |
| N | Mean | Std. deviation | Std. error | 95% Confidence interval for mean | ||
|---|---|---|---|---|---|---|
| Lower bound | Upper bound | |||||
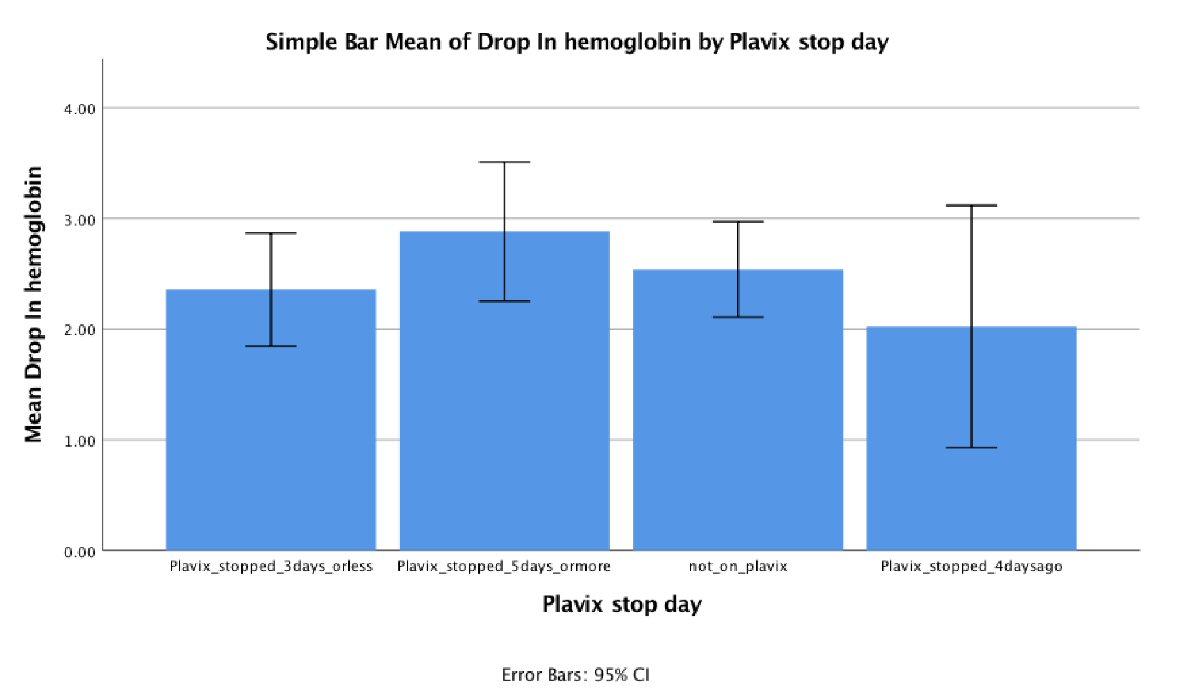
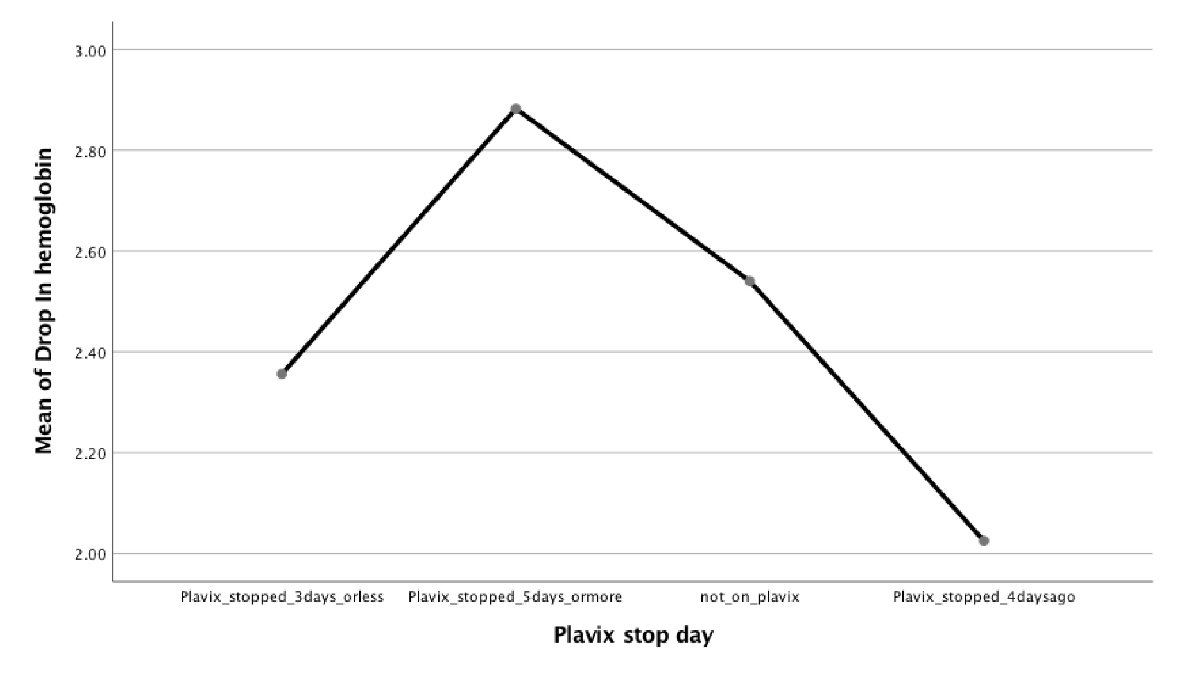
| Data are presented as mean ± standard deviation. The fall in hemoglobin (g/dL) in group 1 (stopped clopidogrel 3 days or less before CABG) was 2.36 ± 1.24 (n = 25); the fall in group 2 (stopped clopidogrel 5 days prior to CABG) was 2.89 ± 1.22 (n = 17); the fall in hemoglobin in group 3 (patients not on clopidogrel) was 2.54 ± 1.35 (n = 40); and the fall in hemoglobin in group 4 (patients stopped clopidogrel 4 days prior to CABG) was 2.02 ± 1.31 (n = 8). | ||||||
| Clopidogrel stopped 3 days or less | 25 | 2.3560 | 1.23628 | 0.24726 | 1.8457 | 2.8663 |
| Clopidogrel stopped 5 days | 17 | 2.8824 | 1.22384 | 0.29683 | 2.2531 | 3.5116 |
| Not on clopidogrel | 40 | 2.5400 | 1.34904 | 0.21330 | 2.1086 | 2.9714 |
| Clopidogrel stopped 4 days ago | 8 | 2.0250 | 1.30903 | 0.46281 | 0.9306 | 3.1194 |
| Total | 90 | 2.5078 | 1.29165 | 0.13615 | 2.2372 | 2.7783 |
| Sum of squares | df | Mean square | F | Sig. | |
|---|---|---|---|---|---|
| There were no statistically significant differences in fall in hemoglobin on ANOVA in all the different groups. F(3, 86) = 0.972, P = 0.410. | |||||
| Between groups | 4.867 | 3 | 1.622 | 0.972 | 0.410 |
| Within groups | 143.617 | 86 | 1.670 | ||
| Total | 148.485 | 89 | |||
| (J) Clopidogrel stop day | Mean difference (I-J) | Std. error | Sig. | 95% Confidence interval | |
|---|---|---|---|---|---|
| Lower bound | Upper bound | ||||
| There was no statistically significant difference between any groups when compared to the other groups regarding the fall in hemoglobin during the surgery. This is demonstrated in the table for multiple outcomes (aComparison with group 1; bComparison with group 2; cComparison with group 3; dComparison with group 4). | |||||
| Clopidogrel stopped 5daysa | -0.52635 | 0.40624 | 0.568 | -1.5907 | 0.5380 |
| Not on clopidogrela | -0.18400 | 0.32947 | 0.944 | -1.0472 | 0.6792 |
| Clopidogrel stopped 4 days agoa | 0.33100 | 0.52492 | 0.922 | -1.0443 | 1.7063 |
| Clopidogrel stopped 3 days or lessb | 0.52635 | 0.40624 | 0.568 | -0.5380 | 1.5907 |
| Not on clopidogrelb | 0.34235 | 0.37414 | 0.797 | -0.6379 | 1.3226 |
| Clopidogrel stopped 4 days agob | 0.85735 | 0.55406 | 0.414 | -0.5943 | 2.3090 |
| Clopidogrel stopped 3 days or lessc | 0.18400 | 0.32947 | 0.944 | -0.6792 | 1.0472 |
| Clopidogrel stopped 5 daysc | -0.34235 | 0.37414 | 0.797 | -1.3226 | 0.6379 |
| Clopidogrel stopped 4 days agoc | 0.51500 | 0.50050 | 0.733 | -0.7963 | 1.8263 |
| Clopidogrel stopped 3 days or lessd | -0.33100 | 0.52492 | 0.922 | -1.7063 | 1.0443 |
| Clopidogrel stopped 5 daysd | -0.85735 | 0.55406 | 0.414 | -2.3090 | 0.5943 |
| Not on clopidogreld | -0.51500 | 0.50050 | 0.733 | -1.8263 | 0.7963 |
| Pre-operative | Post-operative | Delta | |
|---|---|---|---|
| Overall | 12.5 | 9.8 | -2.4 |
| Cases | 11.8 | 9.3 | -2.5 |
| Controls | 12.8 | 10.3 | -2.5 |
| Study group | Fall in hemoglobin (g/dL) |
|---|---|
| Clopidogrel stopped 3 days or less before surgery | n = 25, 2.36 ± 1.24 |
| Clopidogrel stopped 5 days before surgery | n = 17, 2.89 ± 1.22 |
| Clopidogrel stopped 4 days before surgery | n = 8, 2.02 ± 1.31 |
| No clopidogrel | n = 40, 2.54 ± 1.35 |
| Patient group | Total number of patients | Number requiring PRBC transfusion | Percentage requiring PRBC transfusion |
|---|---|---|---|
| Cases | n = 50 | n = 12 | 24.00% |
| Controls | n = 40 | n = 9 | 22.50% |
| Total | n = 90 | n = 21 | 23.33% |