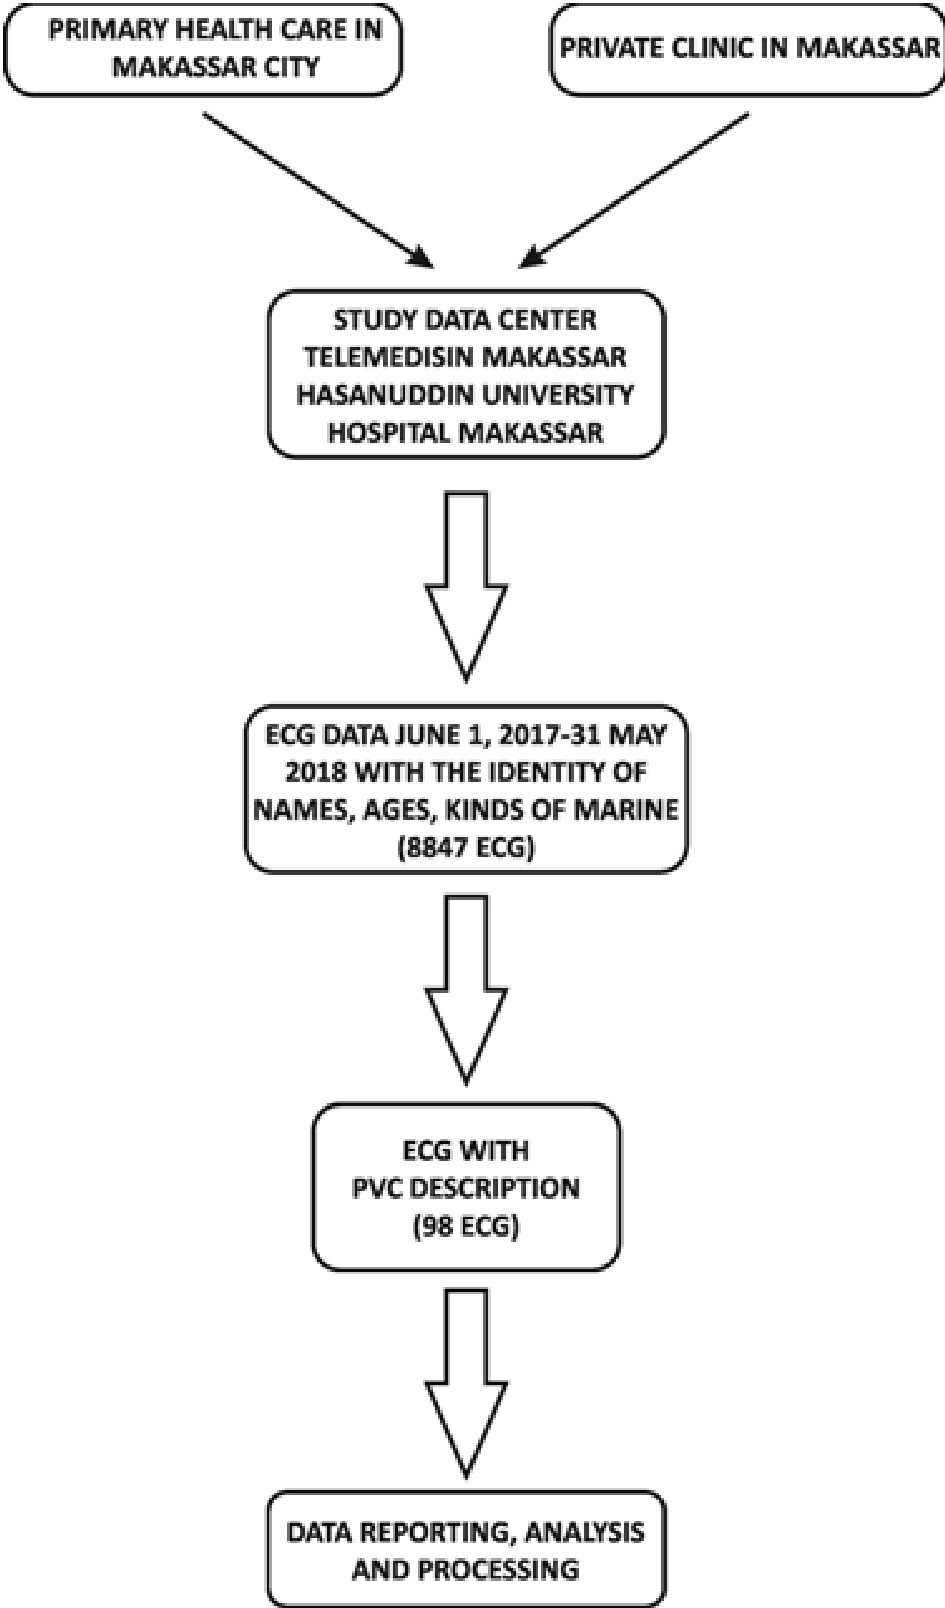
Figure 1. The flow of data retrieval.
| Cardiology Research, ISSN 1923-2829 print, 1923-2837 online, Open Access |
| Article copyright, the authors; Journal compilation copyright, Cardiol Res and Elmer Press Inc |
| Journal website http://www.cardiologyres.org |
Original Article
Volume 10, Number 5, October 2019, pages 285-292
Characteristics and Prevalence of Premature Ventricular Complex: A Telemedicine Study
Figures
Tables
| Variable | N | % |
|---|---|---|
| Sex | ||
| Male | 47 | 48.0 |
| Female | 51 | 52.0 |
| Age category | ||
| 17-25 years | 5 | 5.1 |
| 26-45 years | 32 | 32.7 |
| 46-65 years | 50 | 51.0 |
| >65 years | 11 | 11.2 |
| ECG examination | ||
| Basic rhythm | ||
| Sinus rhythm | 88 | 82.4 |
| Sinus bradycardia | 3 | 3.1 |
| Sinus tachycardia | 4 | 4.1 |
| Atrial fibrillation | 3 | 3.1 |
| Suggestive ECG ischemia/infarct pathological Q | ||
| None | 93 | 94.9 |
| Anteroseptal OMI | 1 | 1.0 |
| Inferior OMI | 4 | 4.1 |
| ST segment | ||
| Isoelectric | 93 | 94.9 |
| ST depression | 1 | 1.0 |
| Early repolarization | 4 | 4.1 |
| Morphology of T waves | ||
| Normal | 97 | 99.0 |
| Inversion | 1 | 1.0 |
| Ventricular hypertrophy | ||
| Left ventricular hypertrophy | ||
| None | 91 | 92.9 |
| Yes | 7 | 7.1 |
| Right ventricular hypertrophy | ||
| None | 96 | 97.9 |
| Yes | 2 | 2.1 |
| QTc interval | ||
| Normal | 77 | 78.6 |
| Long | 17 | 17.3 |
| Short | 4 | 4.1 |
| Repetitive PVC | ||
| No | 67 | 68.4 |
| Bigeminy | 11 | 11.2 |
| Trigeminy | 14 | 14.3 |
| Quadrigeminy | 5 | 5.1 |
| Coupon | 1 | 1.0 |
| Lown’s classification | ||
| Grade 1 or 2 | 89 | 90.8 |
| Grade 3 | 4 | 4.1 |
| Grade 4 | 3 | 3.1 |
| Grade 5 | 2 | 2.0 |
| Axis PVC | ||
| Superior | 86 | 87.8 |
| Inferior | 12 | 12.2 |
| QRS PVC duration | ||
| < 140 ms | 45 | 45.9 |
| 140 - 159 ms | 31 | 31.6 |
| ≥ 160 ms | 22 | 22.4 |
| Coupling interval | ||
| < 300 ms | 2 | 2.0 |
| 300 - 500 ms | 86 | 87.8 |
| ≥ 600 ms | 10 | 10.2 |
| Morphology of PVC in lead V1 | ||
| RBBB | 19 | 22.4 |
| LBBB | 75 | 77.6 |
| Variable | QRS PVC duration | P value | ||
|---|---|---|---|---|
| < 140 ms | 140 - 159 ms | ≥ 160 ms | ||
| Sex | ||||
| Male | 18.4 | 13.3 | 16.3 | 0.030 |
| Female | 27.6 | 18.4 | 6.12 | |
| Age category (year) | ||||
| 17-25 years | 1.0 | 2.0 | 2.0 | 0.012 |
| 26-45 years | 13.3 | 15.3 | 4.1 | |
| 46-65 years | 21.0 | 14.0 | 15.0 | |
| >65 years | 10.2 | 0.0 | 1.0 | |
| Variable | Coupling interval PVC | P value | ||
|---|---|---|---|---|
| < 300 ms | 300 - 599 ms | ≥ 600 ms | ||
| Sex | ||||
| Male | 1.02 | 42.9 | 4.0 | 0.868 |
| Female | 1.02 | 44.9 | 6.1 | |
| Age category (year) | ||||
| 17-25 years | 0.0 | 4.0 | 1.0 | 0.864 |
| 26-45 years | 1.0 | 27.6 | 4.1 | |
| 46-65 years | 1.0 | 44.9 | 5.0 | |
| >65 years | 0.0 | 11.0 | 0.0 | |
| Variable | Morphology of PVC in lead 1 | P value | |
|---|---|---|---|
| RBBB | LBBB | ||
| Sex | |||
| Male | 25.5 | 34.5 | 0.646 |
| Female | 19.6 | 80.4 | |
| Age category (year) | |||
| 17-25 years | 0.0 | 100 | 0.020 |
| 26-45 years | 12.5 | 87.5 | |
| 46-65 years | 24.0 | 76.0 | |
| >65 years | 54.5 | 45.5 | |