Cardiology Research, ISSN 1923-2829 print, 1923-2837 online, Open Access
Article copyright, the authors; Journal compilation copyright, Cardiol Res and Elmer Press Inc
Journal website http://www.cardiologyres.org

Original Article

Volume 10, Number 5, October 2019, pages 293-302


Sacubitril/Valsartan Therapy for 14 Months Induces a Marked Improvement of Global Longitudinal Strain in Patients With Chronic Heart Failure: A Retrospective Cohort Study

Figures

Figure 1.
Figure 1. On the two sides of the figure, there are the LVEF values collected from the group of CHF patients treated with conventional therapy over a mean therapy duration of 14 ± 3 months. Initial mean LVEF value: 38.07 ± 5.44%; final mean LVEF value: 41.59 ± 5.28% (P < 0.0001) (paired samples t-test). LVEF: left ventricular ejection fraction; CHF: chronic heart failure.
Figure 2.
Figure 2. On the two sides of the figure, there are the GLS values collected from the group of CHF patients treated with conventional therapy over a mean therapy duration of 14 ± 3 months. Initial mean GLS value: -12.05 ± 4.01%; final mean GLS value: -12.25 ± 4.28% (P = 0.40) (paired samples t-test). GLS: left ventricular ejection fraction; CHF: chronic heart failure.
Figure 3.
Figure 3. On the two sides of the figure, there are the LVEF values, recorded before the onset of the therapy with sacubitril/valsartan (left side) and after a mean therapy duration of 14 ± 3 months (right side). Initial mean LVEF value: 39.71 ± 4.78%; final mean LVEF value: 42.11 ± 5.68% (P = 0.0003) (paired samples t-test). LVEF: left ventricular ejection fraction.
Figure 4.
Figure 4. On the two sides of the figure, there are the GLS values, recorded before the onset of the therapy with sacubitril/valsartan (left side) and after a mean therapy duration of 14 ± 3 months (right side). Initial mean GLS value: -10.14 ± 3.08%; final mean GLS value: -18.23 ± 7.28% (P < 0.001) (paired samples t-test). GLS: global longitudinal strain.

Table

Table 1. Comparison of Demographics and Clinical, Laboratory and Echocardiographic Features of Patients Examined in the Retrospective Study According to Whether or Not a CHF Patient Was Treated With Sacubitril/Valsartan
 
Patients treated with sacubitril/valsartan (n = 44)Patients treated with conventional therapy (without sacubitril/valsartan) (n = 88)P-value
CHF: chronic heart failure; SD: standard deviation; BMI: body mass index; SBP: systolic blood pressure; CMP: cardiomyopathy; CABG: coronary artery bypass graft; DM: diabetes mellitus; COPD: chronic obstructive pulmonary disease; ICD: implantable cardioverter defibrillator; NYHA: New York Heart Association; LVEF: left ventricular ejection fraction; LVESD: left ventricular end-systolic diameter.
Baseline demographics
  Age (years, mean ± SD)76 ± 5.575 ± 7.50.4341
  Male sex, n (%)31 (70.5%)60 (68.2%)0.9470
  BMI on admission (kg/m2, mean ± SD)28.2 ± 6.8727.2 ± 50.3427
  Heart rate at the first visit (beats/min, mean ± SD)90 ± 1985 ± 200.1711
  Heart rate after 6 months (beats/min, mean ± SD)64 ± 1880 ± 20< 0.0001
  SBP at the first visit (mm Hg, mean ± SD)115 ± 26125 ± 300.0617
  SBP after 6 months (mm Hg, mean ± SD)110 ± 21115 ± 180.1574
Comorbidities
  Ischemic etiology of HF, n (%)20 (45.4%)40 (45.4%)0.8529
  Valvular etiology of HF, n (%)7 (15.9%)15 (17%)0.9342
  CMP-induced HF, n (%)12 (27.2%)27 (30.6%)0.8396
  Other cause of HF, n (%)5 (11.3%)6 (6.8%)0.5179
  Atrial fibrillation, n (%)22 (50%)22 (25%)0.0074
  CABG, n (%)10 (22.7%)25 (34%)0.2550
  History of hypertension, n (%)25 (56.8%)46 (52.2%)0.7576
  DM on insulin, n (%)10 (22.7%)25 (28.4%)0.6255
  COPD, n (%)5 (11.3%)11 (12.5%)1.0000
  ICD, n (%)4 (9%)9 (10.2%)1.0000
  NYHA class IV at baseline, n (%)1 (2.2%)6 (6.8%)0.4234
Hematochemical variables
  NT-proBNP at the first visit (pg/mL, mean ± SD)800.84 ± 123756.22 ± 1290.0594
  NT-proBNP after 6 months (pg/mL, mean ± SD)290.5 ± 90.1591.47 ± 213.81< 0.0001
  Serum creatinine (mL/dL, mean ± SD)1.46 ± 0.551.6 ± 0.40.0981
  Serum Na+ at the first visit (mEq/L, mean ± SD)136 ± 1.55137 ± 2.50.0166
  Serum Na+ after 6 months (mEq/L, mean ± SD)138.5 ± 10138.4 ± 8.60.9526
  Serum K+ at the first visit (mEq/L, mean ± SD)4.5 ± 0.64.7 ± 0.90.1851
  Serum K+ after 6 months (mEq/L, mean ± SD)4.8 ± 0.654.1 ± 0.85< 0.0001
Echocardiographic data at the first visit
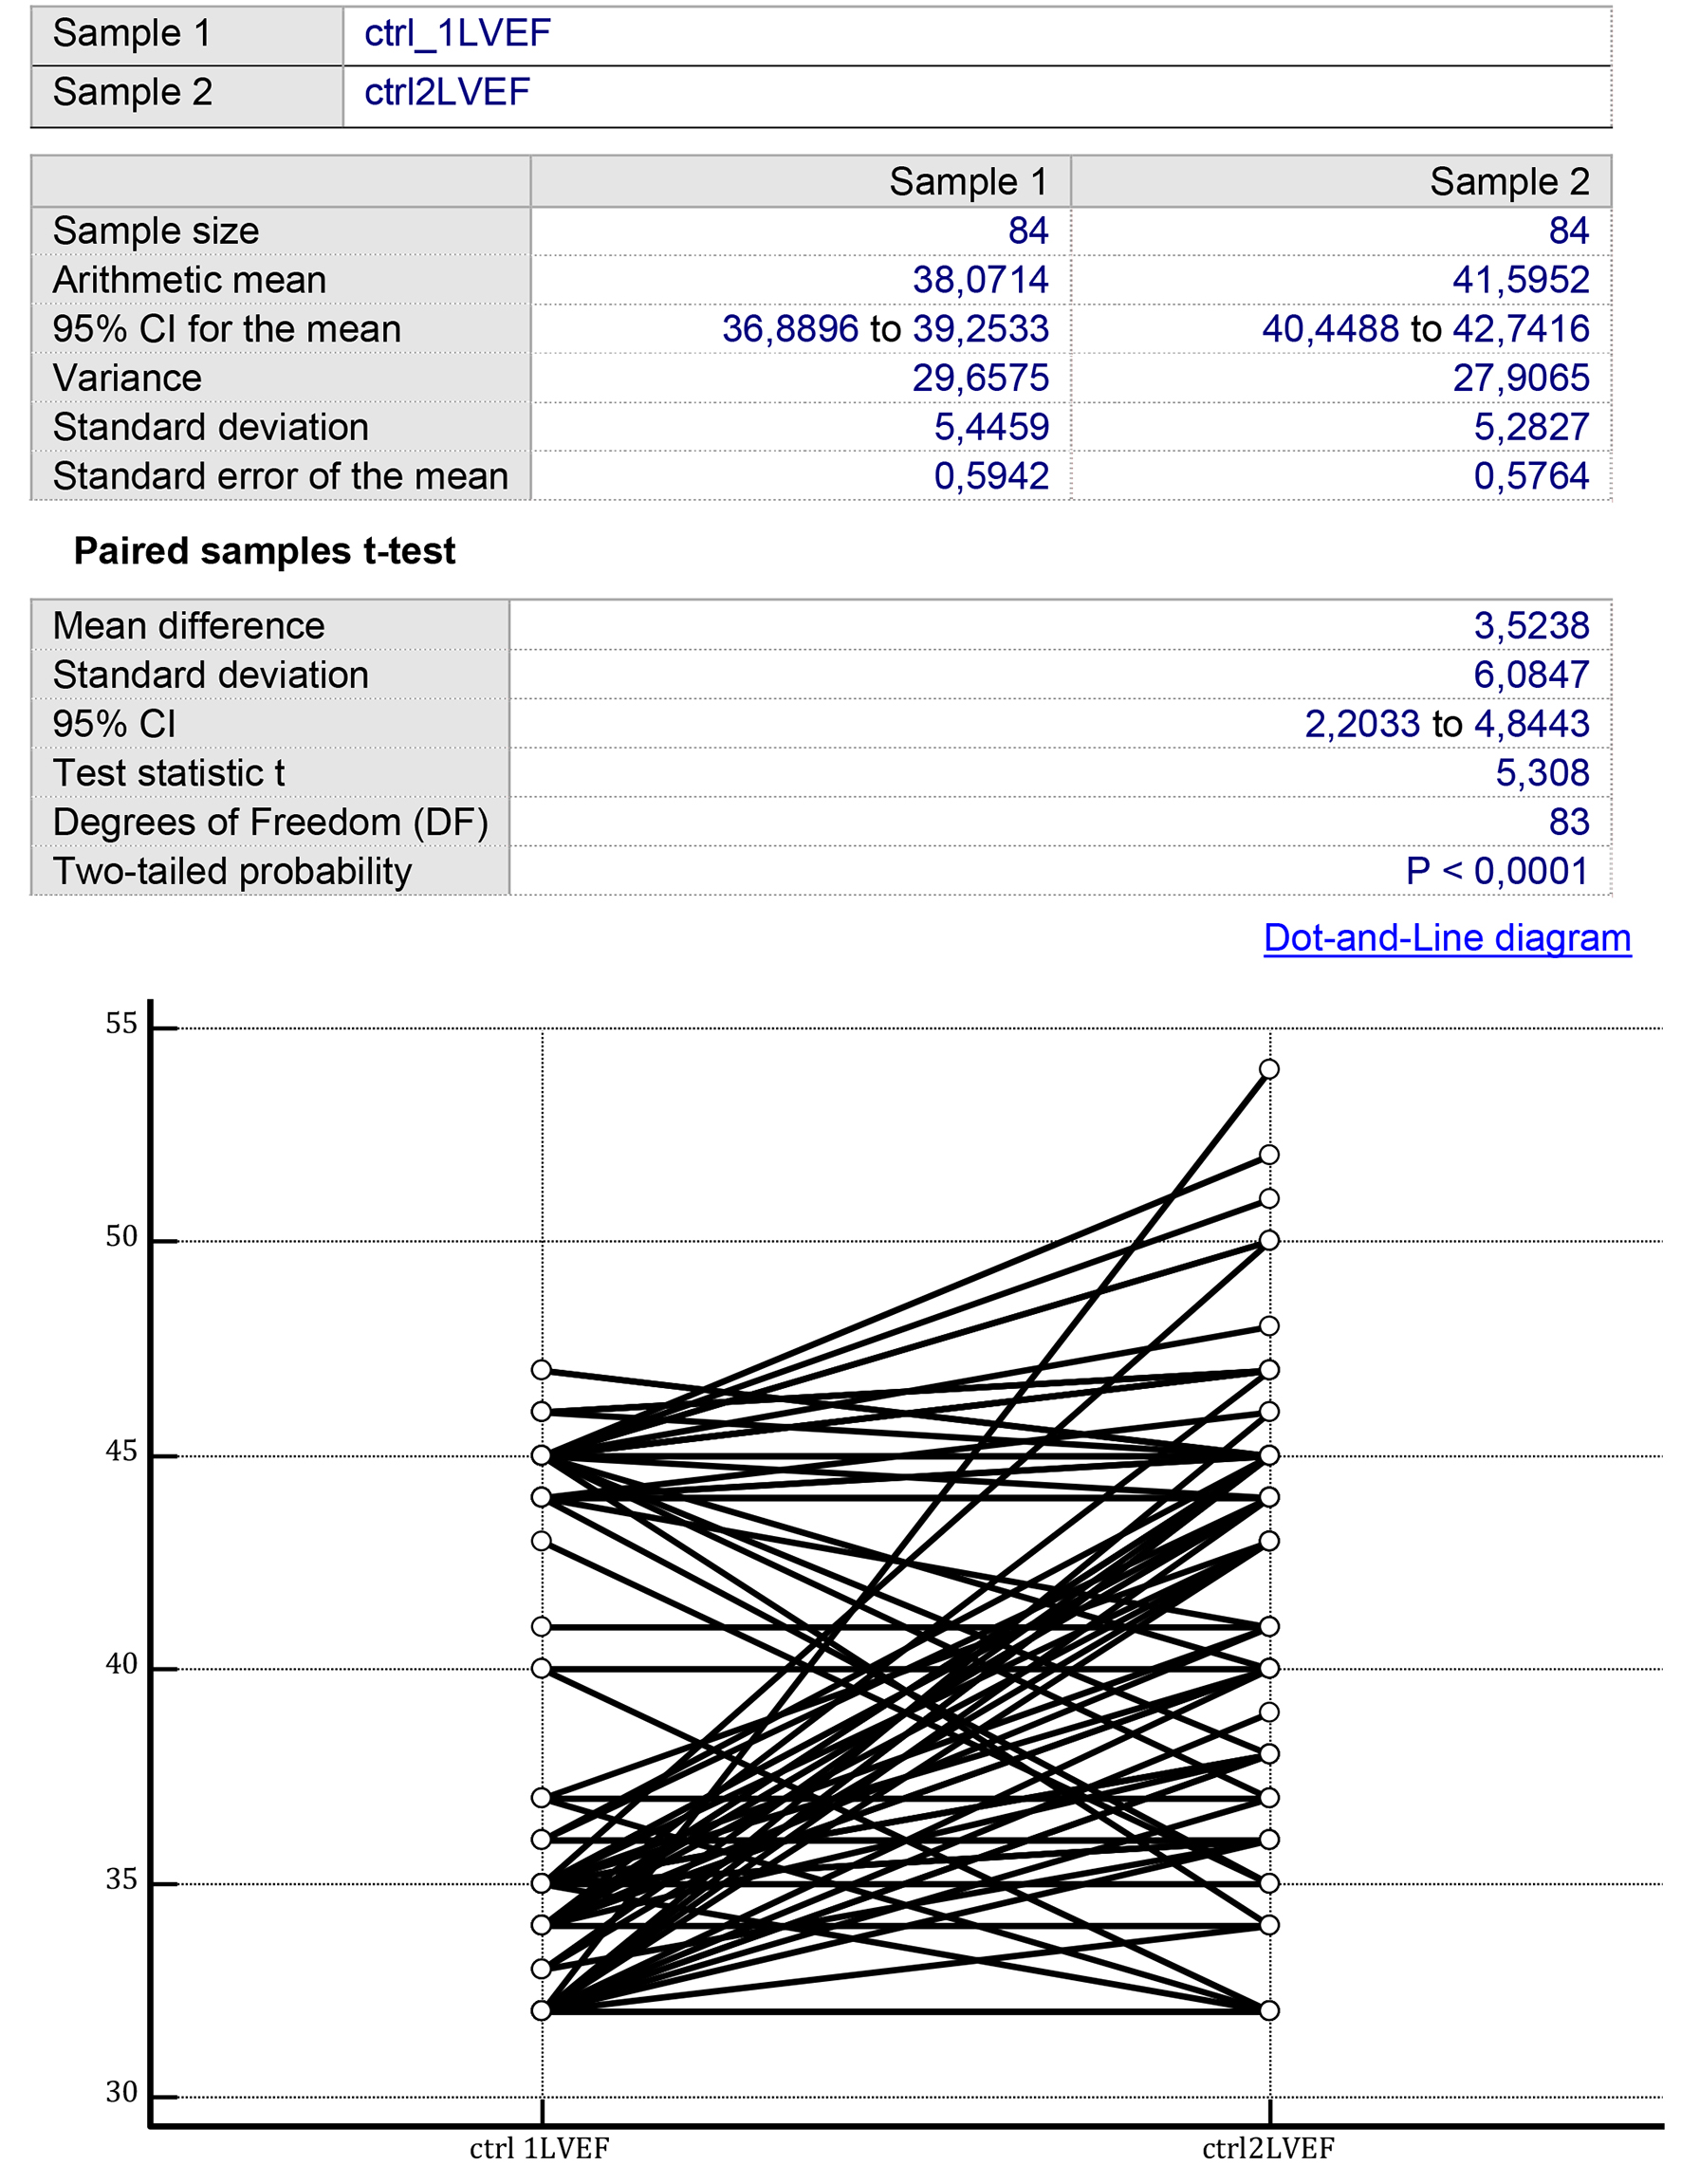
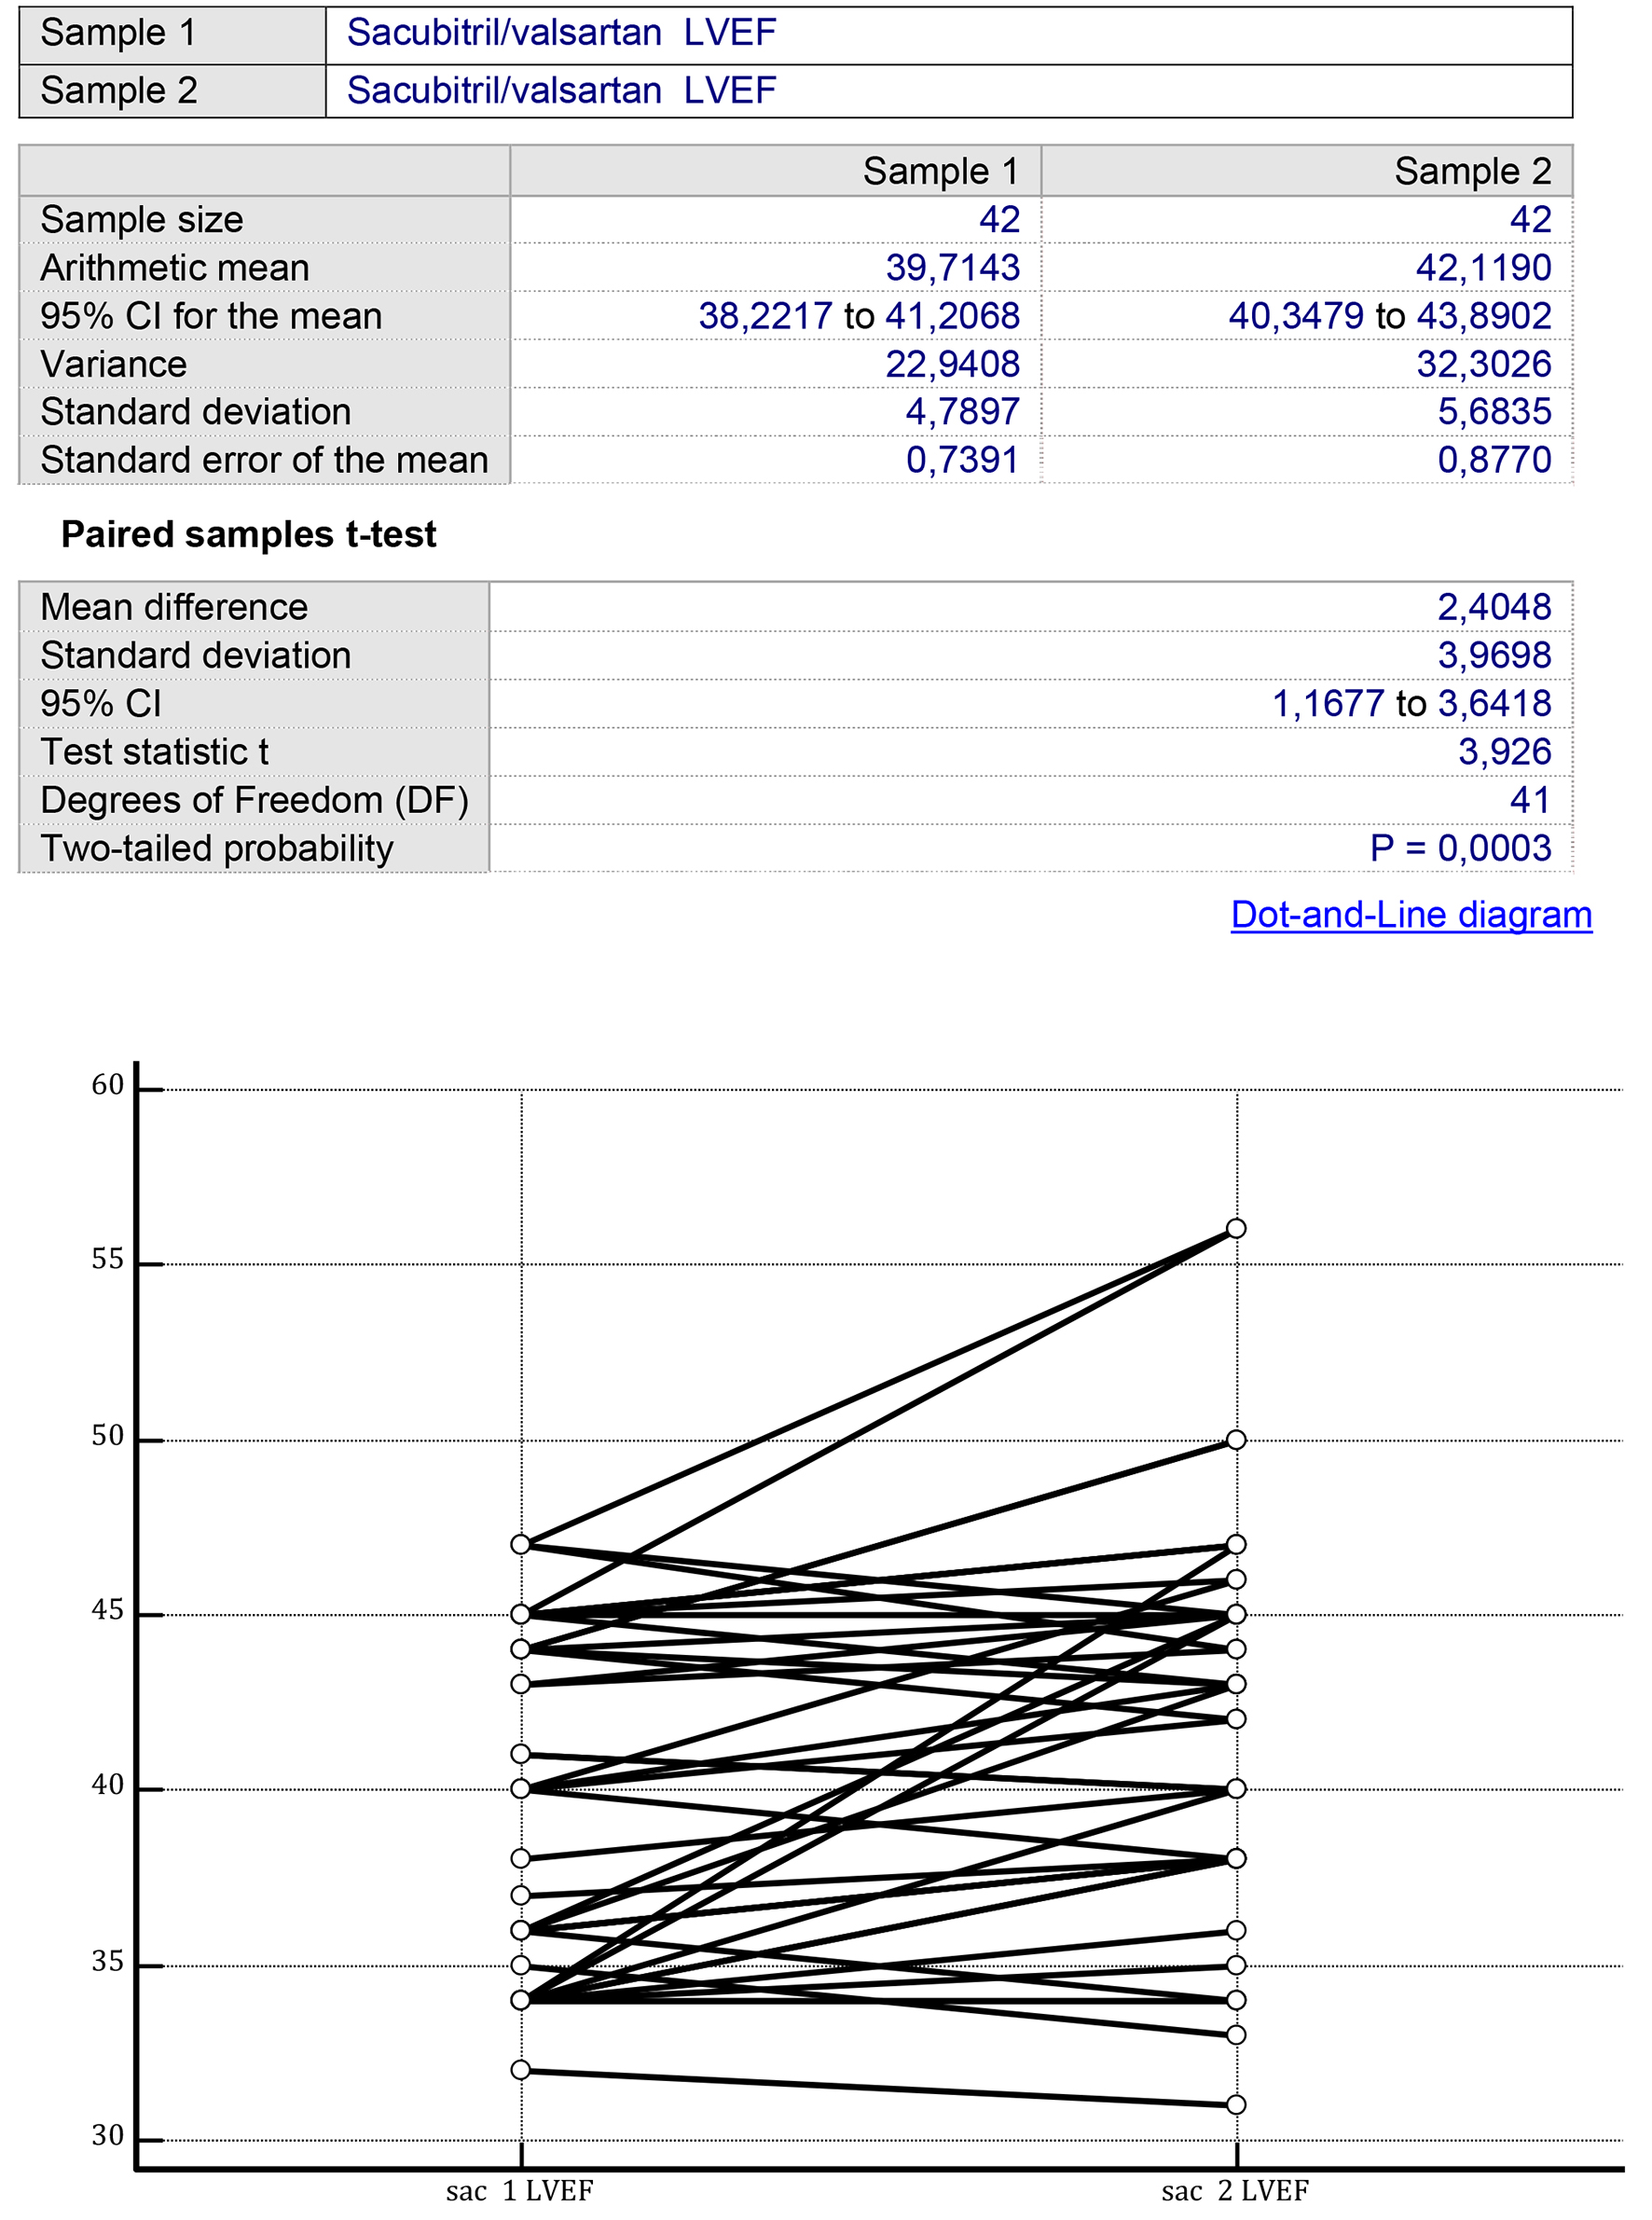
  LVEF (%, mean ± SD)39.71 ± 4.7838 ± 5.440,0790
  LVESD (mm, mean ± SD)58 ± 1059 ± 140.6733
  E/A ratio (mean ± SD)3 ± 1.253.4 ± 1.350.1026
  Deceleration time (ms, mean ± SD)136 ± 22145 ± 250.0362