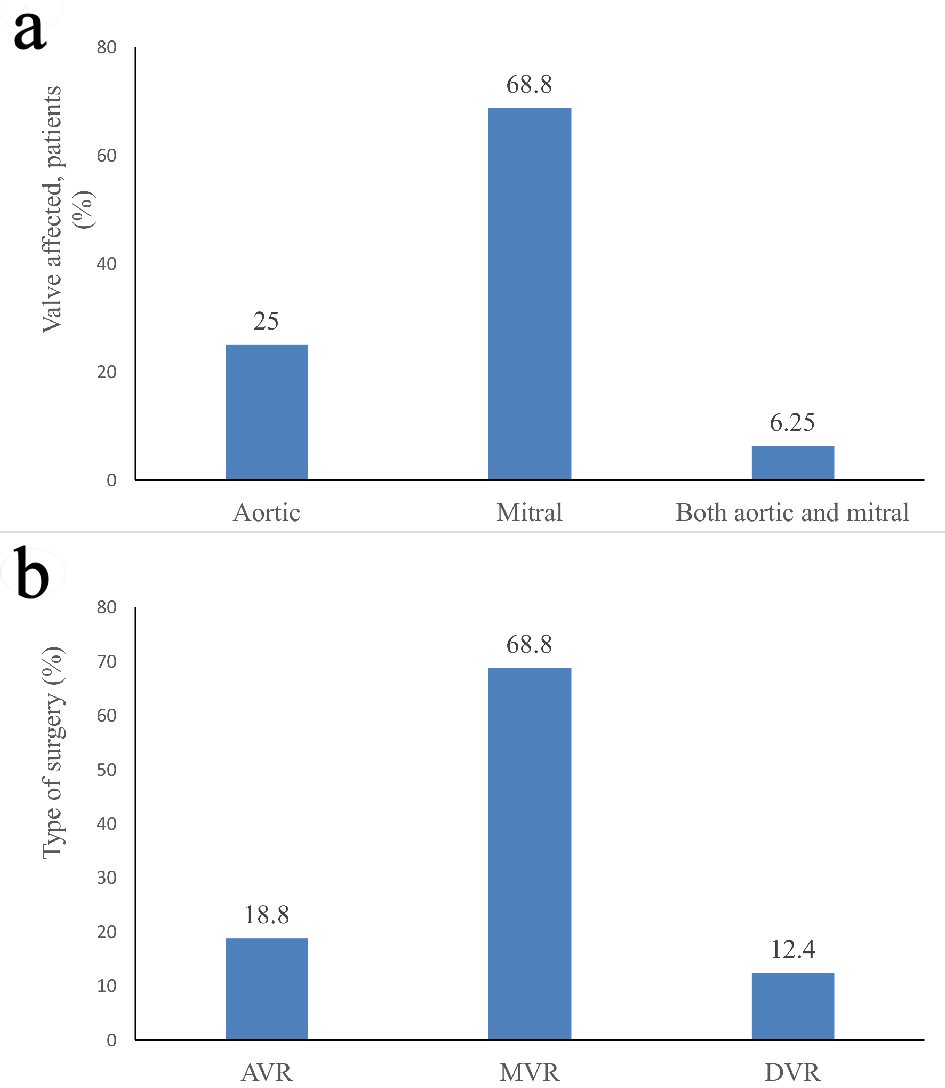
Figure 1. Details of: (a) type of affected valve; (b) type of surgery. AVR: aortic valve replacement; MVR: mitral valve replacement; DVR: double valve replacement.
| Cardiology Research, ISSN 1923-2829 print, 1923-2837 online, Open Access |
| Article copyright, the authors; Journal compilation copyright, Cardiol Res and Elmer Press Inc |
| Journal website http://www.cardiologyres.org |
Original Article
Volume 10, Number 6, December 2019, pages 345-349
Short-Term Clinical Follow-Up After Thrombolytic Therapy in Patients With Prosthetic Valve Thrombosis: A Single-Center Experience
Figure
Tables
| Baseline and demographic characteristics (N = 16) | |
|---|---|
| IQR: interquartile range; BP: blood pressure; LVEF: left ventricular ejection fraction; MDRD: modification of diet in renal disease; eGFR: estimated glomerular filtration rate; NYHA: New York Heart Association; AVR: aortic valve replacement; MVR: mitral valve replacement; DVR: double valve replacement; SD: standard deviation; INR: international normalized ratio. | |
| Age, years (mean ± SD) | 40 ± 11.60 |
| Gender, n (%) | |
| Male | 6 (37.5%) |
| Female | 10 (62.5%) |
| Presentation time after surgery (years), median (IQR) | 3 (1 - 4) |
| Subtherapeutic INR (< 1.6), n (%) | 14 (87.5%) |
| Symptom duration | |
| < 10 days, n (%) | 13 (81.2%) |
| ≥ 10 days, n (%) | 3 (18.8%) |
| Rhythm per minute, mean ± SD | 107.38 ± 20.25 |
| Systolic BP (mm Hg), mean ± SD | 109.14 ± 16.98 |
| Diastolic BP (mm Hg), mean ± SD | 66 ± 8.38 |
| Hemoglobin (g/dL), mean ± SD | 11.81 ± 1.69 |
| Serum creatinine (mg/dL), mean ± SD | 1.24 ± 0.87 |
| MDRD eGFR (mL/min/1.73 m2), mean ± SD | 75.38 ± 35.30 |
| Dyspnea, n (%) | 15 (93.75%) |
| NYHA function class, n (%) | |
| NYHA II | 1 (6.25%) |
| NYHA III | 7 (43.75%) |
| NYHA IV | 8 (50%) |
| LVEF %, n (%) | |
| > 60 | 6 (37.5%) |
| < 60 | 10 (62.5%) |
| Transvalvular gradient | Pre-thrombolysis | 3 days post-thrombolysis | P value |
|---|---|---|---|
| SD: standard deviation. | |||
| Mitral valve | |||
| Peak gradient mean ± SD | 43.79 ± 18.47 | 15.91 ± 7.56 | < 0.05 |
| Mean gradient, mean ± SD | 24.06 ± 8.76 | 8.45 ± 4.01 | < 0.05 |
| Aortic valve | |||
| Peak gradient mean ± SD | 93.5 ± 33.11 | 23.50 ± 6.45 | < 0.05 |
| Mean gradient, mean ± SD | 57.50 ± 26.71 | 13.60 ± 3.83 | < 0.05 |
| Thrombolysis failure/death | 2 (12.50%) | ||
| Hemodynamic success | 13 (81.25%) | ||