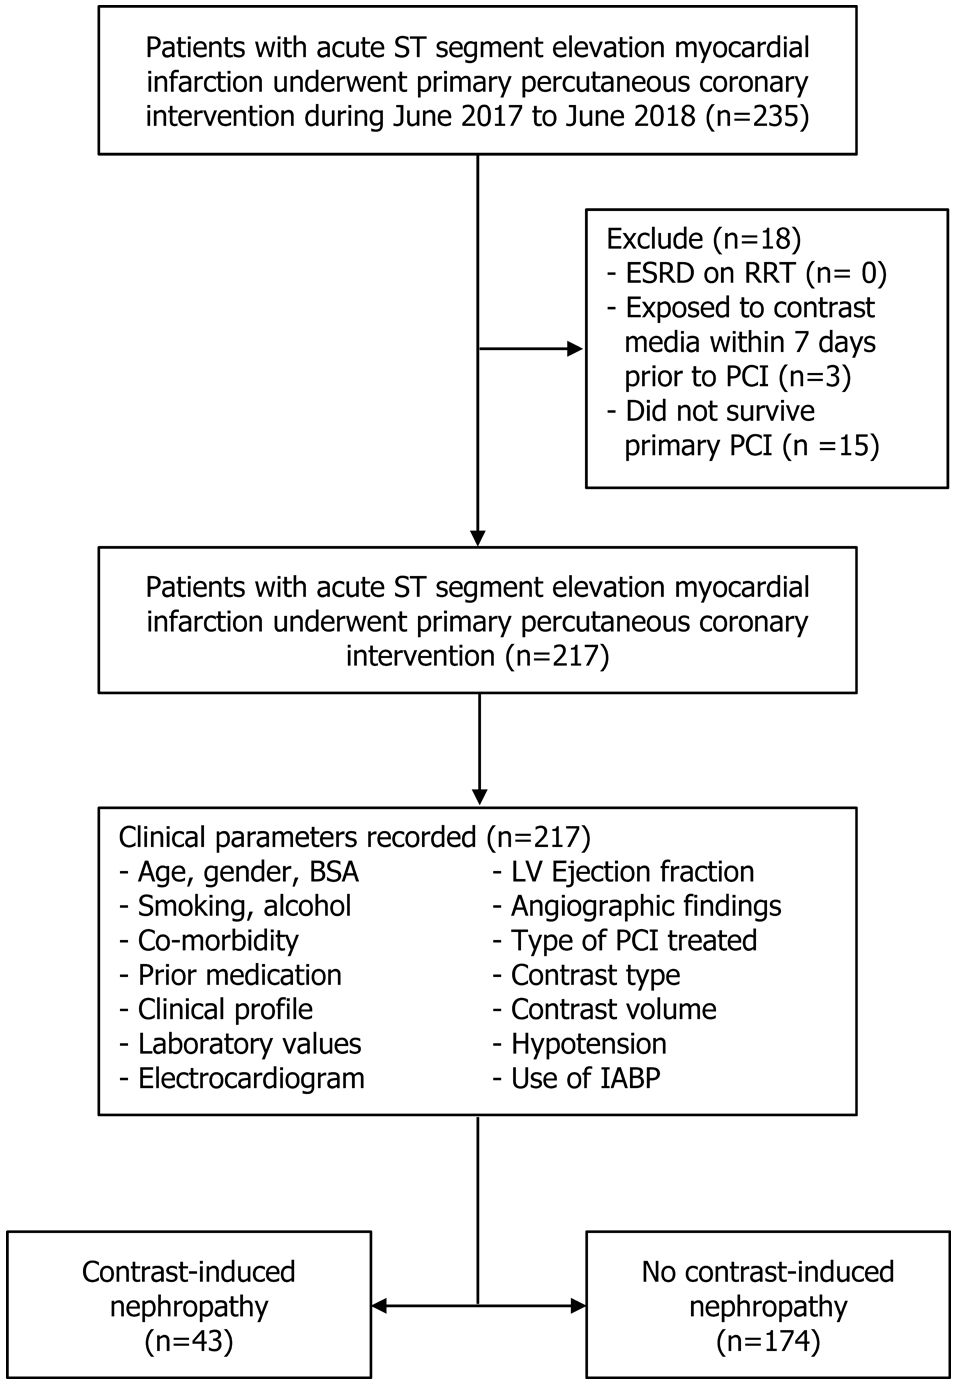
Figure 1. Flow of patients within the study.
| Cardiology Research, ISSN 1923-2829 print, 1923-2837 online, Open Access |
| Article copyright, the authors; Journal compilation copyright, Cardiol Res and Elmer Press Inc |
| Journal website http://www.cardiologyres.org |
Original Article
Volume 10, Number 6, December 2019, pages 350-357
Practical Risk Stratification Score for Prediction of Contrast-Induced Nephropathy After Primary Percutaneous Coronary Intervention in Patients With Acute ST-Segment Elevation Myocardial Infarction
Figures
Tables
| Clinical characteristics | CIN (n = 43) | Without CIN (n = 174) | OR | P value | AuROC (95% CI) |
|---|---|---|---|---|---|
| N (%) | N (%) | ||||
| CIN: contrast-induced nephropathy; SD: standard deviation; OR: odds ratio; AuROC: area under the receiver operating characteristic curve; MI: myocardial infarction; TIA: transient ischemic attack; BSA: body surface area; ACEI: angiotensin-converting enzyme inhibitor; ARB: angiotensin receptor blocker; SBP: systolic blood pressure; DBP: diastolic blood pressure; HR: heart rate; ECG: electrocardiogram; eGFR: estimated glomerular filtration rate; LDL: low-density lipoprotein; HDL: high-density lipoprotein; NA: not applicable. | |||||
| Age, years (mean ± SD) | 66.4 ± 12.3 | 59.6 ± 12.0 | 1.05 | 0.001 | 0.67 (0.57 - 0.76) |
| Male | 29 (67.4) | 129 (74.1) | 0.72 | 0.378 | 0.46 (0.40 - 0.53) |
| BSA, m2 (mean ± SD) | 1.68 ± 0.18 | 1.72 ± 0.18 | 0.24 | 0.134 | 0.43 (0.34 - 0.53) |
| Hypertension | 20 (46.5) | 71 (40.8) | 1.26 | 0.498 | 0.53 (0.46 - 0.60) |
| Diabetes mellitus | 11 (25.6) | 45 (25.9) | 0.99 | 0.970 | 0.50 (0.43 - 0.57) |
| Hypercholesterolemia | 18 (41.9) | 75 (43.1) | 0.95 | 0.883 | 0.49 (0.42 - 0.56) |
| Previous MI | 0 (0.0) | 6 (3.5) | NA | 0.601 | 0.48 (0.42 - 0.55) |
| Previous stroke or TIA | 1 (2.3) | 3 (1.7) | 1.36 | 0.794 | 0.50 (0.43 - 0.57) |
| Anemia | 17 (39.5) | 39 (22.4) | 2.26 | 0.024 | 0.59 (0.52 - 0.65) |
| Smoking | 18 (41.9) | 85 (48.9) | 0.75 | 0.412 | 0.47 (0.40 - 0.53) |
| Alcohol | 3 (7.0) | 20 (11.5) | 0.58 | 0.394 | 0.48 (0.41 - 0.55) |
| Prior medication | |||||
| ACEI or ARB | 2 (4.7) | 19 (10.9) | 0.40 | 0.228 | 0.47 (0.40 - 0.54) |
| Aspirin | 2 (4.7) | 8 (4.6) | 1.01 | 0.988 | 0.50 (0.43 - 0.57) |
| Metformin | 5 (11.6) | 22 (12.6) | 0.91 | 0.857 | 0.49 (0.42 - 0.56) |
| Statins | 9 (20.9) | 32 (18.4) | 1.17 | 0.703 | 0.51 (0.44 - 0.58) |
| Clinical parameters at presentation | |||||
| SBP, mm Hg (mean ± SD) | 103.3 ± 30.9 | 124.1 ± 27.5 | 0.97 | < 0.001 | 0.31 (0.21 - 0.41) |
| DBP, mm Hg (mean ± SD) | 60.7 ± 19.1 | 74.4 ± 16.3 | 0.95 | < 0.001 | 0.30 (0.20 - 0.40) |
| HR, bpm (mean ± SD) | 90.7 ± 25.3 | 81.2 ± 17.4 | 1.03 | 0.005 | 0.64 (0.53 - 0.75) |
| Heart failure | 22 (51.2) | 18 (10.3) | 9.08 | < 0.001 | 0.70 (0.64 - 0.76) |
| Wall of infarction from ECG | |||||
| Inferior wall | 18 (41.9) | 80 (46.0) | 1.00 | 0.193 | - |
| Anterior wall | 25 (58.1) | 83 (47.7) | 1.33 | ||
| Other | 0 | 11 (6.3) | - | ||
| Ejection fraction | |||||
| < 40% | 30 (69.8) | 39 (22.4) | 7.99 | < 0.001 | 0.74 (0.67 - 0.79) |
| ≥ 40% | 13 (30.2) | 135 (77.6) | |||
| Laboratory values | |||||
| Creatinine, mg/dL (mean ± SD) | 1.2 ± 0.6 | 1.0 ± 0.5 | 1.61 | 0.103 | 0.57 (0.46 - 0.67) |
| eGFR, mL/min/1.73 m2 (mean ± SD) | 68.3 ± 26.7 | 81.3 ± 25.5 | 0.98 | 0.004 | 0.35 (0.26 - 0.45) |
| Hematocrit, % (mean ± SD) | 38.6 ± 7.2 | 41.3 ± 5.6 | 0.93 | 0.010 | 0.38 (0.28 - 0.48) |
| Cholesterol, g/dL (mean ± SD) | 224.6 ± 75.1 | 195.0 ± 49.6 | 1.00 | 0.004 | 0.62 (0.52 - 0.72) |
| LDL, mg/dL (mean ± SD) | 151.7 ± 56.0 | 127.7 ± 40.8 | 1.01 | 0.002 | 0.62 (0.52 - 0.73) |
| Triglyceride, mg/dL (mean ± SD) | 153.5 ± 98.9 | 145.2 ± 72.3 | 1.00 | 0.532 | 0.50 (0.40 - 0.60) |
| HDL, mg/dL (mean ± SD) | 46.4 ± 12.0 | 43.5 ± 11.3 | 1.02 | 0.146 | 0.61 (0.52 - 0.70) |
| Procedural findings | CIN (n = 43) | Without CIN (n = 174) | OR | P value | AuROC (95% CI) |
|---|---|---|---|---|---|
| N (%) | N (%) | ||||
| CIN: contrast-induced nephropathy; OR: odds ratio; AuROC: area under the receiver operating characteristic curve; CI: confidence interval; IABP: intra-aortic balloon pump; PCI: percutaneous coronary intervention; SD: standard deviation. | |||||
| Angiographic findings | |||||
| Single-vessel disease | 9 (20.9) | 64 (36.8) | 1.00 | Ref | - |
| Double-vessel disease | 7 (16.3) | 56 (32.2) | 0.89 | 0.826 | - |
| Triple-vessel disease | 27 (62.8) | 54 (31.0) | 3.56 | 0.003 | - |
| PCI treated | |||||
| Culprit vessel PCI | 41 (95.3) | 165 (94.8) | 1.00 | 0.889 | 0.50 (0.43 - 0.57) |
| Multivessel PCI | 2 (4.7) | 9 (5.2) | 0.89 | ||
| Contrast type | |||||
| Ioversol | 1 (2.3) | 10 (5.8) | 1.00 | 0.376 | 0.52 (0.45 - 0.58) |
| Iopromide-370 | 42 (97.7) | 164 (94.3) | 2.56 | ||
| Contrast volume, mL (mean ± SD) | 115.6 ± 45.9 | 112.2 ± 39.7 | 1.00 | 0.625 | 0.51 (0.41 - 0.61) |
| Hypotension | 24 (55.8) | 22 (12.6) | 8.72 | < 0.001 | 0.72 (0.65 - 0.77) |
| Use of IABP | 19 (44.2) | 8 (4.6) | 16.4 | < 0.001 | 0.70 (0.63 - 0.76) |
| Variables | OR | 95% CI | P value |
|---|---|---|---|
| OR: odds ratio; CI: confidence interval; ECG: electrocardiogram; IABP: intra-aortic balloon pump; CHF: congestive heart failure; eGFR: estimated glomerular filtration rate; TVD: triple-vessel disease; PCI: percutaneous coronary intervention. | |||
| Age > 75 years | 3.40 | 1.01 - 11.45 | 0.048 |
| Diabetes mellitus | 0.85 | 0.32 - 2.28 | 0.748 |
| Anemia | 1.30 | 0.46 - 3.73 | 0.621 |
| Hypotension | 2.85 | 0.77 - 10.58 | 0.117 |
| CHF | 1.04 | 0.28 - 3.94 | 0.949 |
| Anterior wall infarction from ECG | 2.49 | 0.99 - 6.24 | 0.052 |
| Ejection fraction < 40% | 4.87 | 1.92 - 12.35 | 0.001 |
| eGFR < 60 mL/min/1.73 m2 | 0.54 | 0.18 - 1.60 | 0.263 |
| Triple-vessel disease | 2.48 | 1.02 - 6.05 | 0.046 |
| PCI treated | 0.19 | 0.02 - 2.08 | 0.175 |
| Iopromide 370 (contrast media) | 8.82 | 0.62 - 124.96 | 0.107 |
| Contrast media volume (every 100 mL increment) | 1.00 | 0.99 - 1.01 | 0.940 |
| Use of IABP | 4.55 | 0.87 - 23.68 | 0.072 |
| Predictors | OR | 95% CI | P value | β | Score |
|---|---|---|---|---|---|
| OR: odds ratio; CI: confidence interval; IABP: intra-aortic balloon pump. | |||||
| Ejection fraction < 40% | 4.47 | 1.94 - 10.35 | 0.001 | 1.50 | 2 |
| Triple-vessel disease | 2.80 | 1.25 - 6.27 | 0.012 | 1.03 | 1 |
| Use of IABP | 6.58 | 2.39 - 18.13 | < 0.001 | 1.88 | 3 |
| Constant | 0.05 | 0.02 - 0.11 | -2.91 | ||
| Risk categories | Score | CIN (n = 43) | Without CIN (n = 174) | PPV | 95% CI | P value | ||
|---|---|---|---|---|---|---|---|---|
| N (%) | N (%) | |||||||
| CCIT: Central Chest Institute of Thailand; CIN: contrast-induced nephropathy; PPV: positive predictive value; CI: confidence interval; SE: standard error. | ||||||||
| Low | 0 - 2 | 17 | 39.5 | 154 | 88.5 | 9.9 | 5.4 - 14.4 | < 0.001 |
| High | 3 - 6 | 26 | 60.5 | 20 | 11.5 | 56.5 | 42.2 - 70.8 | < 0.001 |
| Mean ± SE | 3.3 | ± 0.3 | 0.9 | ± 0.1 | < 0.001 | |||