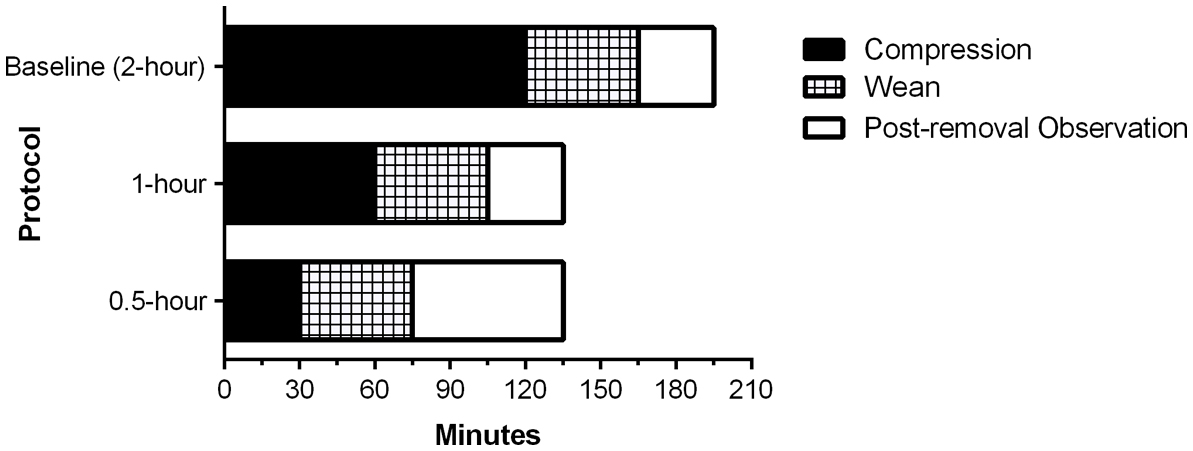
Figure 1. Compression device removal protocol times. This bar graph shows the compression, weaning, and post-removal observation times for patients in our study protocol in each of the three groups studied.
| Cardiology Research, ISSN 1923-2829 print, 1923-2837 online, Open Access |
| Article copyright, the authors; Journal compilation copyright, Cardiol Res and Elmer Press Inc |
| Journal website http://www.cardiologyres.org |
Original Article
Volume 10, Number 6, December 2019, pages 331-335
Expedited Removal of a Radial Hemostatic Compression Device Following Cardiac Catheterization Is Safe and Associated With Reduced Time to Discharge
Figures
Tables
| Characteristic | All groups | 2-h wean | 1-h wean | 0.5-h wean |
|---|---|---|---|---|
| PCI: percutaneous coronary intervention; ACT: activated clotting time (in seconds). aThere were no statistically significant differences among the variables listed across groups as assessed by analysis of variance and t-tests for all possible individual comparisons for the continuous variables and for Fisher’s exact test for the categorical variables. bIn cases where heparin was not used, either bivalirudin or no anticoagulation was used. | ||||
| N | 354 | 99 | 132 | 123 |
| Age (mean) | 67 | 67 | 67 | 66 |
| Gender (% male) | 65% | 64% | 64% | 66% |
| Procedure type | ||||
| Coronary angiography | 81% | 80% | 80% | 85% |
| PCI | 17% | 20% | 18% | 13% |
| Other | 2% | 0% | 2% | 2% |
| Heparin useb | 96% | 96% | 98% | 94% |
| ACT performed | 23% | 21% | 21% | 25% |
| ACT (mean) | 247 | 260 | 246 | 238 |
| Outcome | All groups | 2-h wean | 1-h wean | 0.5-h wean | P valuea |
|---|---|---|---|---|---|
| Serious complications were defined as a composite of severe discomfort, severe hematoma, need for blood transfusion, surgical consultation, or unplanned admission. Times are listed as median values with the interquartile range in brackets. aCalculated using Fisher’s exact test for dichotomous variables and the Kruskal-Wallis test for time-to-event variables for all three groups. HCD: hemostatic compression device; NS: not significant. | |||||
| Serious complications | 0 | 0 | 0 | 0 | - |
| Any bleeding, n, (%) | 49 (14%) | 8 (8%) | 26 (19%) | 15 (12%) | P = 0.032 |
| Any hematoma, n, (%) | 18 (5%) | 3 (3%) | 7 (5%) | 8 (7%) | P = NS |
| Bleeding or hematoma, n, (%) | 58 (16%) | 11 (11%) | 27 (20%) | 20 (16%) | P = NS |
| Time to HCD removal (h) | 2.1 (2.8 - 1.8) | 2.9 (3.2 - 2.8) | 2 (2.3 - 1.8) | 1.6 (1.8 - 1.4) | P < 0.001 |
| Time to discharge (h) | 3.2 (4 - 2.7) | 3.5 (4.3 - 3.2) | 3.0 (3.7 - 2.5) | 3.0 (3.9 - 2.5) | P < 0.001 |
| Event | Diagnostic angiogram only | Percutaneous coronary intervention | Other | P valuea |
|---|---|---|---|---|
| NS: not significant. aCalculated using Fisher’s exact test. | ||||
| Any bleeding, n, (%) | 38 (13%) | 10 (8.5%) | 1 (17%) | P = NS |
| Any hematoma, n, (%) | 13 (4.5%) | 5 (8.5%) | 0 (0%) | P = NS |
| Any bleeding or hematoma, n, (%) | 45 (15.5%) | 12 (19.7%) | 1 (16.7%) | P = NS |
| Total patients | 289 | 59 | 6 | - |