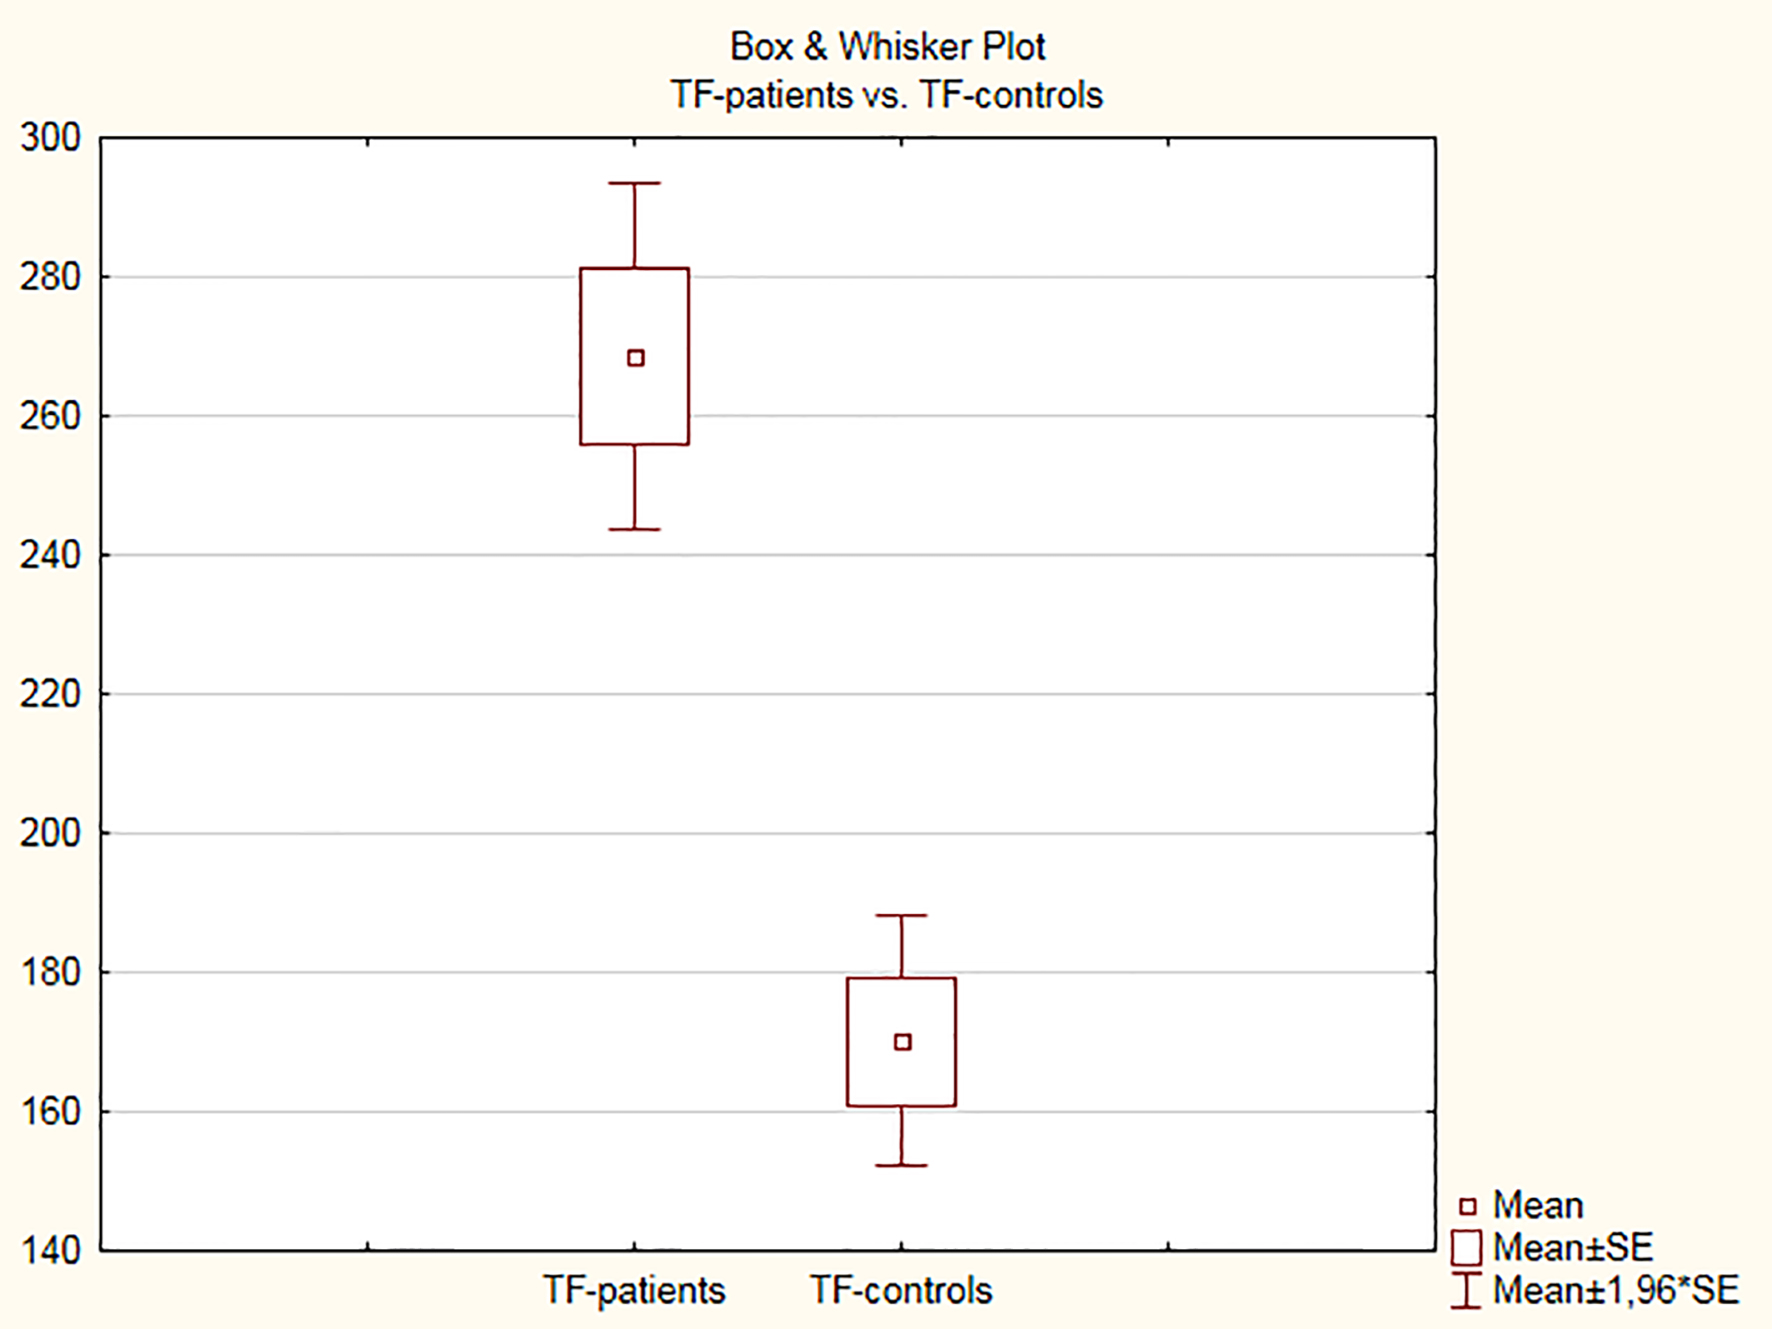
Figure 1. Tissue factor levels in plasma in the control and patient groups.
| Cardiology Research, ISSN 1923-2829 print, 1923-2837 online, Open Access |
| Article copyright, the authors; Journal compilation copyright, Cardiol Res and Elmer Press Inc |
| Journal website http://www.cardiologyres.org |
Original Article
Volume 11, Number 1, February 2020, pages 22-32
Paroxysmal Atrial Fibrillation: Insight Into the Intimate Mechanisms of Coagulation
Figures

Tables
| Patients with PAF | Control group | P values | |
|---|---|---|---|
| CHA2DS2-VASc score - congestive heart failure, hypertension, age ≥ 75 years, diabetes mellitus, stroke/transient ischemic attack/thromboembolism, vascular disease (prior myocardial infarction, peripheral vascular disease, or aortic atherosclerosis), age (65 - 74 years) and sex category (female). According to CHA2DS2-VASc score, patients were divided into low-risk (score < 2) and high-risk (score ≥ 2) for the emergence of embologenic risk according to the recommendations of the European Society of Cardiology [17]. PAF: paroxysmal atrial fibrillation; ACE: angiotensin converting enzyme; BMI: body mass index. | |||
| Number of participants | 51 | 52 | 0.89 |
| Mean age (years) | 59.84 ± 11.42 | 59.50 ± 10.53 | 0.87 |
| Men/women | 26/25 | 26/26 | 1/0.93 |
| Accompanying diseases | |||
| Hypertension | 37 (72.54%) | 34 (65.38%) | 0.44 |
| Diabetes mellitus type 2 | 3 (5.88%) | 2 (3.84%) | 0.62 |
| Dyslipidemia | 4 (7.84%) | 3 (5.77%) | 0.69 |
| Medicaments for hypertension and dyslipidemia | |||
| Beta blockers | 19 (37.25%) | 17 (32.69%) | 0.62 |
| ACE inhibitors | 15 (29.41%) | 14 (26.92%) | 0.78 |
| Sartans | 11 (21.57%) | 9 (17.31%) | 0.58 |
| Statins | 4 (7.84%) | 3 (5.77%) | 0.69 |
| Deleterious habits | |||
| Smoking | 8 (15.69%) | 7 (13.46%) | 0.75 |
| Alcohol intake | 7 (13.72%) | 6 (11.53%) | 0.74 |
| BMI (kg/m2) | 23.85 ± 3.28 | 24.95 ± 3.24 | 0.09 |
| CHA2DS2-VASc score | No score | ||
| Number of patients with score < 2 | 25 | ||
| Number of patients with score ≥ 2 | 26 | ||
| Echocardiographic indicators | Patients with PAF | Control group | P values |
|---|---|---|---|
| PAF: paroxysmal atrial fibrillation; LVEDD: left ventricular end-diastolic dimension; LVESD: left ventricular end-systolic dimension; EF: ejection fraction; IVS: interventricular septum thickness; PW: posterior wall; LA: left atrial; RVEDD: right ventricular end-diastolic dimension. | |||
| LVEDD (mm) | 52.57 ± 5.43 | 52.29 ± 5.44 | 0.73 |
| LVESD (mm) | 34.43 ± 5.34 | 34.73 ± 4.99 | 0.69 |
| EF (%) | 62.98 ± 5.97 | 61.54 ± 5.49 | 0.12 |
| IVS (mm) | 10.37 ± 3.42 | 9.92 ± 3.68 | 0.20 |
| PW (mm) | 10.24 ± 3.27 | 9.73 ± 3.82 | 0.16 |
| LA volume (mL/m2) | 22.81 ± 4.80 | 23.82 ± 5.00 | 0.13 |
| RVEDD (mm) | 30.54 ± 8.98 | 29.17 ± 8.51 | 0.18 |