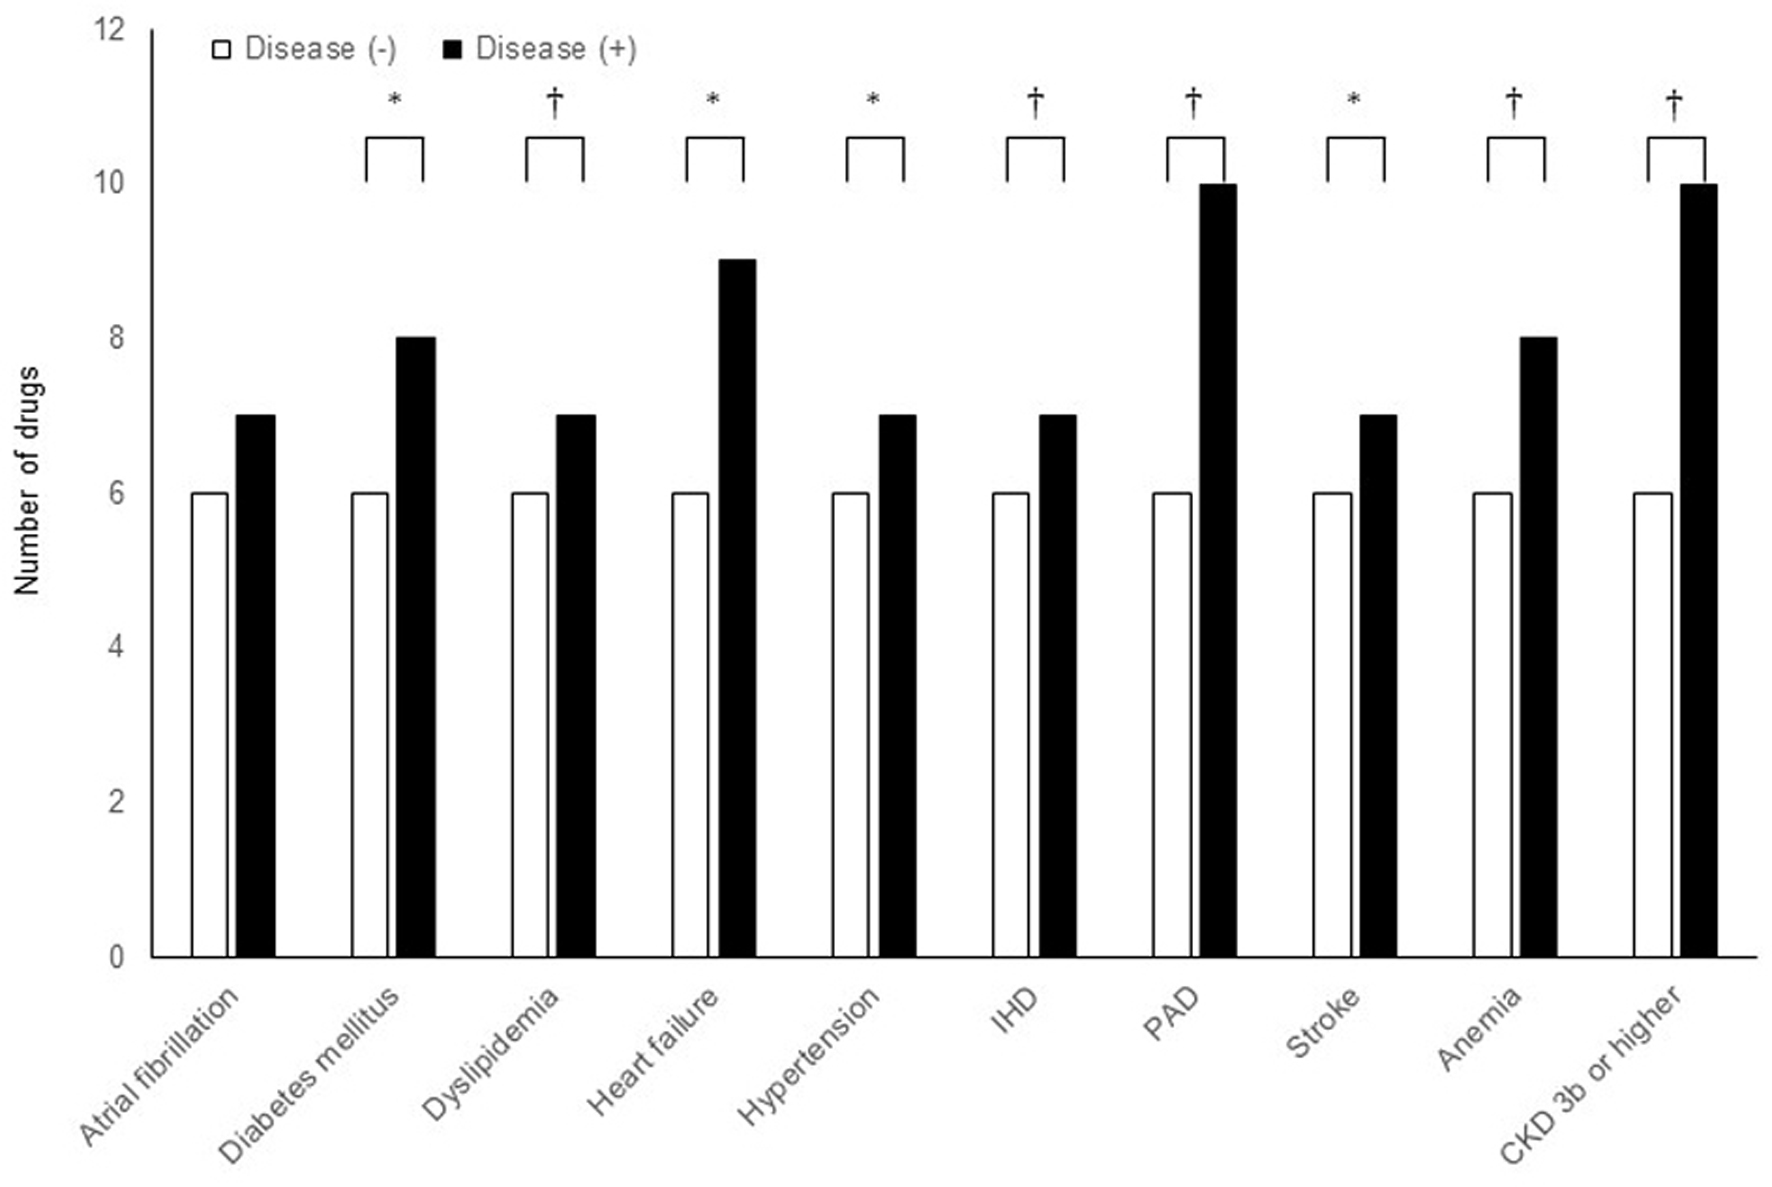
Figure 1. The numbers of drugs prescribed for the patients with each comorbidity as the median of each group. *P < 0.05, †P < 0.01 in Mann-Whitney U-test.
| Cardiology Research, ISSN 1923-2829 print, 1923-2837 online, Open Access |
| Article copyright, the authors; Journal compilation copyright, Cardiol Res and Elmer Press Inc |
| Journal website http://www.cardiologyres.org |
Original Article
Volume 11, Number 1, February 2020, pages 15-21
Polypharmacy Is Associated With Accelerated Deterioration of Renal Function in Cardiovascular Outpatients
Figure
Tables
| Classification of polypharmacy | P value | ||||
|---|---|---|---|---|---|
| All | non-PP (0 - 4) | PP (5 - 9) | hyper-PP (≥ 10) | ||
| The data are presented as mean ± SD for normally distributed variables, median (first quartile, third quartile) for not normally distributed variables, or the number (percentage) for categorical variables. Differences in categorical variables between groups were assessed using Fisher’s exact test followed by Holm’s post hoc test. Differences in continuous variables between groups were assessed using one-way analysis of variance (ANOVA) followed by Tukey’s post hoc test for normally distributed variables, or Kruskal-Wallis’s test followed by Steel-Dwass’s post hoc test for not normally distributed variables. BMI: body mass index; Cr: serum creatinine; CV: cardiovascular; CVD: cardiovascular disease; eGFR: estimated glomerular filtration rate; Hb: hemoglobin; Ht: hematocrit; IHD: ischemic heart disease; PAD: peripheral artery disease; Plt: platelet; PP: polypharmacy; RBC: red blood cells; RDW-CV: red blood cell distribution width-coefficient of variation; WBC: white blood cell. aP < 0.05, non-PP vs. PP; bP < 0.05, non-PP vs. hyper-PP; cP < 0.05, PP vs. hyper-PP. | |||||
| N | 259 | 68 (26.25) | 132 (50.97) | 59 (22.78) | |
| Age (years) | 72 (64, 78) | 70 (63, 75) | 72 (66, 78) | 73 (62, 80) | 0.057 |
| Male gender (%) | 173 (66.8) | 38 (55.9) | 95 (72.0) | 40 (67.8) | 0.075 |
| BMI (kg/m2) | 24.0 ± 3.9 | 23.2 ± 3.7 | 24.0 ± 3.9 | 24.8 ± 3.8 | 0.069 |
| WBC (102/µL) | 60.6 ± 17.6 | 55.4 ± 13.4 | 62.6 ± 18.8a | 62.0 ± 18.1 | 0.017 |
| Plt (104/µL) | 19.3 ± 5.4 | 19.8 ± 5.2 | 19.1 ± 5.3 | 19.0 ± 5.9 | 0.599 |
| RBC (104/µL) | 441 ± 63 | 455 ± 47 | 444 ± 61 | 417 ± 78b, c | 0.002 |
| Hb (g/dL) | 13.5 ± 1.8 | 14.1 ± 1.4 | 13.6 ± 1.9 | 12.8 ± 1.8b, c | < 0.001 |
| Ht (%) | 40.9 ± 5.0 | 42.3 ± 3.8 | 41.1 ± 5.3 | 39.1 ± 5.2b, c | 0.002 |
| RDW-CV | 13.6 (13.0, 14.1) | 13.3 (12.8, 13.7) | 13.7 (13.1, 14.1)a | 13.7 (13.1, 14.8)b | < 0.001 |
| Anemia (%) | 74 (28.6) | 6 (8.8) | 37 (28.0)a | 31 (52.5)b, c | < 0.001 |
| Cr (mg/dL) | 0.84 (0.68, 1.01) | 0.72 (0.62, 0.84) | 0.85 (0.70, 0.99)a | 1.01 (0.81, 1.32)b, c | < 0.001 |
| eGFR (mL/min/1.73 m2) | 65.4 ± 20.9 | 73.8 ± 17.3 | 66.2 ± 19.1a | 54.0 ± 23.4b, c | < 0.001 |
| Number of CVDs or their risk factors | 3 (2, 4) | 2 (1, 2) | 3 (2, 4)a | 4 (2, 5)b, c | < 0.001 |
| CVD or its risk factor | |||||
| Atrial fibrillation (%) | 47 (18.1) | 10 (14.7) | 22 (16.7) | 15 (25.4) | 0.262 |
| Diabetes mellitus (%) | 98 (37.8) | 12 (17.6) | 52 (39.4)a | 34 (57.6)b, c | < 0.001 |
| Dyslipidemia (%) | 150 (57.9) | 32 (47.1) | 81 (61.4) | 37 (62.7) | 0.114 |
| Heart failure (%) | 56 (21.6) | 7 (10.3) | 24 (18.2) | 25 (42.4)b, c | < 0.001 |
| Hypertension (%) | 184 (71.0) | 43 (63.2) | 94 (71.2) | 47 (79.7) | 0.127 |
| IHD (%) | 129 (49.8) | 20 (29.4) | 71 (53.8)a | 38 (64.4)b | < 0.001 |
| PAD (%) | 24 (9.3) | 1 (1.5) | 10 (7.6) | 13 (22.0)b, c | < 0.001 |
| Stroke (%) | 28 (10.8) | 3 (4.4) | 15 (11.4) | 10 (16.9) | 0.060 |
| All | Classification of polypharmacy | P value | |||
|---|---|---|---|---|---|
| non-PP (0 - 4) | PP (5 - 9) | hyper-PP (≥ 10) | |||
| The data are presented as median (first quartile, third quartile) for not normally distributed variables, or the number (percentage) for categorical variables. Differences in categorical variables between groups were assessed using Fisher’s exact test followed by Holm’s post hoc test. Differences in continuous variables between groups were assessed using Kruskal-Wallis’s test followed by Steel-Dwass’s post hoc test for not normally distributed variables. ACEI: angiotensin-converting enzyme inhibitor; ARB: angiotensin receptor blocker; CV: cardiovascular; H2-blocker: histamine type 2 receptor blocker; NSAID: nonsteroidal anti- inflammatory drug; PP: polypharmacy; PPI: proton pump inhibitor; statins: HMG-CoA reductase inhibitor. aP < 0.05, non-PP vs. PP; bP < 0.05, non-PP vs. hyper-PP; cP < 0.05, PP vs. hyper-PP. | |||||
| N | 259 | 68 (26.25) | 132 (50.97) | 59 (22.78) | |
| Number of drugs | 7 (4, 9) | 3 (1, 3) | 7 (6, 8)a | 12 (10, 14)b, c | < 0.001 |
| Number of CV drugs | 4 (3, 6) | 2 (1, 3) | 5 (4, 6)a | 8 (6, 9)b, c | < 0.001 |
| ACEI (%) | 39 (15.1) | 4 (5.9) | 22 (16.7) | 13 (22.0)b | 0.023 |
| Antiarrhythmic agent | 24 (9.3) | 4 (5.9) | 7 (5.3) | 13 (22)b, c | 0.002 |
| Anticoagulant (%) | 67 (25.9) | 8 (11.8) | 37 (28.0)a | 22 (37.3)b | 0.002 |
| Antiplatelet agents (%) | 152 (58.7) | 15 (22.1) | 93 (70.5)a | 44 (74.6)b | < 0.001 |
| ARB (%) | 141 (54.4) | 22 (32.4) | 78 (59.1)a | 41 (69.5)b | < 0.001 |
| Calcium channel blockers (%) | 120 (46.3) | 27 (39.7) | 59 (44.7) | 34 (57.6) | 0.115 |
| Cardiac stimulant | 10 (3.9) | 1 (1.5) | 4 (3.0) | 5 (8.5) | 0.135 |
| Diuretics (%) | 80 (30.9) | 6 (8.8) | 39 (29.5)a | 35 (59.3)b, c | < 0.001 |
| Hypolipidemic agent other than statins | 19 (7.3) | 1 (1.5) | 10 (7.6) | 8 (13.6)b | 0.002 |
| Insulin (%) | 11 (4.2) | 0 (0.0) | 2 (1.5)a | 9 (15.3)b | < 0.001 |
| Oral hypoglycemic agents (%) | 59 (22.8) | 0 (0.0) | 32 (24.2)a | 27 (45.8)b, c | < 0.001 |
| Statins (%) | 120 (46.3) | 10 (14.7) | 78 (59.1)a | 32 (54.2)b | < 0.001 |
| Vasodilator agent | 44 (17.0) | 2 (2.9) | 24 (18.2)a | 18 (30.5)b | < 0.001 |
| β-blockers (%) | 124 (47.9) | 16 (23.5) | 67 (50.8)a | 41 (69.5)b, c | < 0.001 |
| Number of non-CV drugs | 2 (1, 3) | 0 (0, 1) | 2 (1, 3)a | 3 (3, 7)b, c | < 0.001 |
| Antianxiety or hypnotic (%) | 55 (21.2) | 4 (5.9) | 30 (22.7)a | 21 (35.6)b | < 0.001 |
| Cathartic (%) | 52 (20.1) | 3 (4.4) | 22 (16.7)a | 27 (45.8)b, c | < 0.001 |
| H2-blockers (%) | 26 (10.0) | 3 (4.4) | 15 (11.4) | 8 (13.6) | 0.162 |
| NSAIDs (%) | 13 (5.0) | 1 (1.5) | 4 (3.0)a | 8 (13.6)b | 0.004 |
| PPI (%) | 88 (34.0) | 4 (5.9) | 49 (37.1)a | 35 (59.3)b, c | < 0.001 |
| Uric acid-lowering agents (%) | 46 (17.8) | 6 (8.8) | 21 (15.9) | 19 (32.2)b, c | 0.003 |
| Factor | ρ | P value |
|---|---|---|
| Correlations between each variable were examined using Spearman’s rank correlation coefficient rho (ρ). BMI: body mass index; CVD: cardiovascular disease; eGFR: estimated glomerular filtration rate; Hb: hemoglobin; Plt: platelet; WBC: white blood cell. | ||
| Number of CVDs or their risk factors | 0.484 | < 0.001 |
| eGFR (mL/min/1.73 m2) | -0.336 | < 0.001 |
| Hb (g/dL) | -0.217 | < 0.001 |
| Plt (104/µL) | -0.153 | 0.014 |
| Age (years) | 0.151 | 0.015 |
| WBC (102/µL) | 0.143 | 0.021 |
| BMI (kg/m2) | 0.127 | 0.041 |
| Factor | β | P value |
|---|---|---|
| Factors which were independently associated with the number of drugs were examined using linear regression analysis. CVD: cardiovascular disease; CKD: chronic kidney disease; WBC: white blood cell; Plt: platelet; BMI: body mass index. | ||
| Number of CVDs or their risk factors | 1.033 | < 0.001 |
| Anemia | 1.722 | < 0.001 |
| CKD stage 3b or higher | 1.923 | 0.002 |
| WBC (102/µL) | 0.022 | 0.081 |
| Plt (104/µL) | -0.049 | 0.229 |
| Male | 0.504 | 0.244 |
| BMI (kg/m2) | 0.025 | 0.638 |
| Age (years) | -0.009 | 0.672 |
| Factor | ρ | P value |
|---|---|---|
| The factors which correlated with the changing rate of eGFR were examined using Spearman’s rank correlation coefficient. eGFR: estimated glomerular filtration rate; Plt: platelet; Hb: hemoglobin; CVD: cardiovascular disease; WBC: white blood cell; BMI: body mass index. | ||
| Number of prescribed drugs | 0.151 | 0.030 |
| Age | 0.087 | 0.213 |
| Plt | -0.072 | 0.298 |
| Hb | -0.065 | 0.353 |
| eGFR | -0.061 | 0.378 |
| Number of CVDs or their risk factors | 0.050 | 0.473 |
| WBC | -0.048 | 0.494 |
| BMI | 0.024 | 0.728 |