

| Cardiology Research, ISSN 1923-2829 print, 1923-2837 online, Open Access |
| Article copyright, the authors; Journal compilation copyright, Cardiol Res and Elmer Press Inc |
| Journal website https://www.cardiologyres.org |
Original Article
Volume 11, Number 6, December 2020, pages 392-397
Correlations Between the Ankle-Brachial Index, Percentage of Mean Arterial Pressure, and Upstroke Time for Endovascular Treatment
Yoh Aritaa, b, Nobuyuki Ogasawaraa, Shinji Hasegawaa
aDepartment of Cardiology, Japan Community Healthcare Organization (JCHO) Osaka Hospital, 4-2-78, Fukushima, Fukushima-ku, Osaka, 553-0003, Japan
bCorresponding Author: Yoh Arita, Department of Cardiology, Japan Community Healthcare Organization (JCHO) Osaka Hospital, 4-2-78, Fukushima, Fukushima-ku, Osaka, 553-0003, Japan
Manuscript submitted August 9, 2020, accepted August 22, 2020, published online November 2, 2020
Short title: Insight of Percentage of Mean Arterial Pressure
doi: https://doi.org/10.14740/cr1146
| Abstract | ▴Top |
Background: The ankle-brachial index (ABI), percentage of mean arterial pressure (%MAP), and upstroke time (UT) are indicators to diagnose lower-extremity peripheral artery disease (PAD). However, the respective relationship between these parameters is unknown. In this study, we analyzed the correlations between ABI, %MAP, and UT and examined their clinical usefulness for endovascular treatment (EVT).
Methods: Sixty-three consecutive subjects who underwent successful EVT for aortoiliac to femoropopliteal artery diseases were analyzed. The ABI, %MAP, and UT were measured using an automated oscillometric device.
Results: There were significant correlations between the ABI and %MAP (r = -0.425, P < 0.001), the ABI and UT (r = -0.304, P = 0.017), and %MAP and UT (r = 0.368, P = 0.003). In terms of lesion length, there was a significant difference in %MAP after EVT (focal, 42.6%; short, 44.5%; intermediate, 47.1%; long, 49.1%; P = 0.015). There was minimal %MAP improvement in the case of a long lesion length (focal, -8.83%; short, -5.10%; intermediate, -3.00%; long, -1.50%; P = 0.006). Excessive lesion calcification also hindered %MAP improvement (grade 0, -7.16%; grade 1, -5.52%; grade 2, -4.71%; grade 3, -2.80%; grade 4, -1.00%; P = 0.049). Patients who underwent re-EVT (an average of 10.1 months after initial EVT) had minimal %MAP improvement (-2.76% vs. -5.95%, P = 0.035) at the first outpatient visit (an average of 3.3 weeks after EVT).
Conclusions: In conclusion, the ABI, %MAP, and UT are correlated with each other. If the length of the lesion is long and there is excessive calcification, %MAP improvement is minimal. Moreover, minimal %MAP improvement may be an indicator of future restenosis.
Keywords: Ankle-brachial index; Percentage of mean arterial pressure; Upstroke time; Endovascular treatment; Calcification
| Introduction | ▴Top |
Lower-extremity peripheral artery disease (PAD) is the third leading cause of atherosclerotic cardiovascular morbidity, following coronary artery disease and stroke [1]. A quantitative assessment of lower-limb atherosclerosis is important for the diagnosis of existing PAD [2]. The ankle-brachial index (ABI) is the ratio of the systolic blood pressure measured at the ankle to that measured at the brachial artery. An ABI ≤ 0.90 should be considered the threshold for confirming the diagnosis of lower-extremity PAD [3-7]. The ABI is an indicator of atherosclerosis at other vascular sites and can serve as a prognostic marker for cardiovascular events and functional impairment, even in the absence of PAD symptoms [8, 9]. It is also an indicator of the therapeutic effect of endovascular treatment (EVT) [10].
The percentage of mean arterial pressure (%MAP) is the height of the mean area of the arterial wave divided by the peak amplitude [11, 12]. The upstroke time (UT) indicates the time interval between the onset and peak of a pulse volume wave [13]. According to the guidelines of the Japan Circulation Society on using non-invasive vascular function testing to detect patients with PAD, the cut-off values are 45% and 180 ms for %MAP and UT, respectively [14].
A combination of ABI, %MAP, and UT is necessary to increase the diagnostic accuracy for PAD, particularly for mild arterial stenosis [11, 15]. However, the relationships between these parameters as well as their clinical implications, except for PAD diagnosis, are unknown. In this study, we analyzed the correlations between ABI, %MAP, and UT and examined their clinical usefulness for EVT.
| Materials and Methods | ▴Top |
A total of 63 consecutive Japanese patients (mean age, 73.3 years; 24% women) who underwent successful EVT for aortoiliac to femoropopliteal artery disease at the Japan Community Healthcare Organization Osaka Hospital (Osaka, Japan) between January 2017 and December 2018 were included in this study. Patients with acute thrombosis, in-stent restenosis, unavailable ABI data, and surgical bypass graft surgery were excluded. In addition, patients who did not show post-EVT improvements in the ABI and/or angiographic stenosis were excluded.
The ABI data were obtained using an automated oscillometric device (VP-1000; Omron Healthcare Co., Kyoto, Japan). This device also automatically calculates the %MAP and UT from the pulse volume wave. The lesion length was classified as follows: focal, ≤ 1 cm; short, > 1 and < 5 cm; intermediate, ≥ 5 and < 15 cm; and long, ≥ 15 cm [16]. The extent of lesion calcification was classified according to the peripheral arterial calcium scoring system (PACSS; grade 0, no visible calcification; grade 1, unilateral calcification, < 5 cm; grade 2, unilateral calcification, ≥ 5 cm; grade 3, bilateral calcification, < 5 cm; and grade 4, bilateral calcification, ≥ 5 cm) [17].
Statistical analyses were performed using EZR [18]. The data are expressed as mean ± standard deviation or number (%). The continuous variables were compared using an analysis of variance or a Student’s t-test. P values of < 0.05 were considered statistically significant. The study was approved by the Institutional Review Board of Japan Community Healthcare Organization Osaka Hospital. This study was conducted in compliance with the ethical standards of the responsible institution on human subjects as well as with the Helsinki Declaration.
| Results | ▴Top |
The patient characteristics are summarized in Table 1. Patients undergoing hemodialysis were accounted for 27% of all patients, and current smokers accounted for 63% of all patients. The mean ABI, %MAP, and UT before EVT were 0.66 ± 0.12, 49.9±4.7%, and 224 ± 51 ms, respectively. The lesion characteristics are summarized in Table 2. Before EVT, there were significant correlations between the ABI and %MAP (r = -0.425, P < 0.001), the ABI and UT (r = -0.304, P = 0.017), and the %MAP and UT (r = 0.368, P = 0.003) (Fig. 1a-c). The mean ABI, %MAP, and UT had improved 1 day after EVT (0.92 ± 0.17, 45.8±4.9%, and 189 ± 36 ms, respectively) (Fig. 2a-c). Compared to the pre-EVT correlations, the correlations were stronger 1 day after EVT (ABI vs. %MAP, r = -0.502, P < 0.001; ABI vs. UT, r = -0.317, P = 0.011; %MAP vs. UT, r = 0.701; P < 0.001) (Fig. 3a-c). In terms of lesion length, there was no difference in %MAP values before EVT; however, there was a significant difference after EVT (focal, 42.6±3.98%; short, 44.5±4.99%; intermediate, 47.1±4.48%; long, 49.1±3.65%; P = 0.015) (Fig. 4a, b). Although the extent of improvement in the ABI and UT did not differ according to the lesion length, the improvement in the %MAP was minimal in the case of a long lesion length (focal, -8.83±4.40%; short, -5.10±4.60%; intermediate, -3.00±3.85%; long, -1.50±2.39%; P = 0.006) (Fig. 4c). There was minimal %MAP improvement in the case of excessive lesion calcification (grade 0, -7.16±4.21%; grade 1, -5.52±4.17%; grade 2, -4.71±3.49%; grade 3, -2.80±4.64%; grade 4, -1.00±2.91%; P = 0.049) (Fig. 4d).
 Click to view | Table 1. Patient Characteristics (N = 63) |
Click to view | Table 2. Lesion Characteristics (N = 63) |
 Click for large image | Figure 1. Pre-EVT scatter plots. (a) The ABI and %MAP; (b) The ABI and UT; and (c) The %MAP and UT. EVT: endovascular treatment; ABI: ankle-brachial index; %MAP: percentage of mean arterial pressure; UT: upstroke time |
 Click for large image | Figure 2. (a) The ABI before and after EVT. (b) The %MAP before and after EVT. (c) The UT before and after EVT. ABI: ankle-brachial index; %MAP: percentage of mean arterial pressure; UT: upstroke time; EVT: endovascular treatment. |
 Click for large image | Figure 3. One day post-EVT scatter plots. (a) The ABI and %MAP; (b) The ABI and UT; and (c) The %MAP and UT. EVT: endovascular treatment; ABI: ankle-brachial index; %MAP: percentage of mean arterial pressure; UT: upstroke time. |
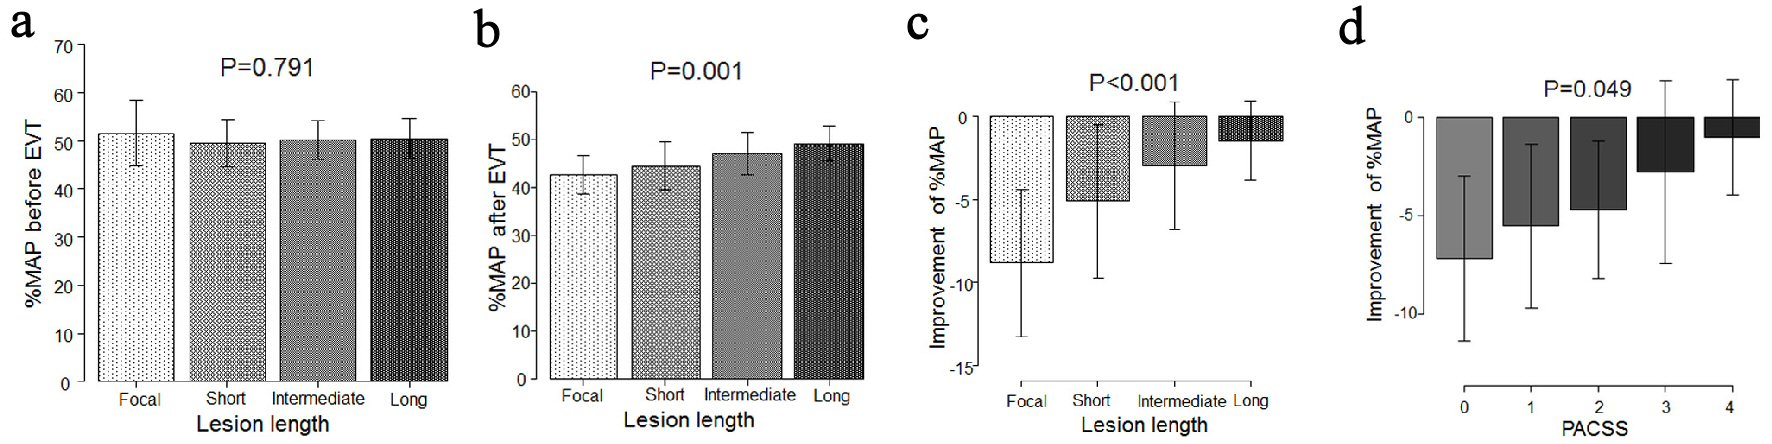 Click for large image | Figure 4. (a) Pre-EVT relationship between %MAP and lesion length. (b) One day post-EVT relationship between %MAP and lesion length. (c) %MAP improvement according to the lesion length before and after EVT. (d) %MAP improvement according to the PACSS before and after EVT. %MAP: percentage of mean arterial pressure; EVT: endovascular treatment; PACSS: peripheral arterial calcium scoring system. |
At the time of the first outpatient visit (i.e., an average of 3.3 weeks after EVT), patients who underwent re-EVT (n = 15, an average of 10.1 months after initial EVT) showed minimal %MAP improvement compared to patients who did not undergo re-EVT (-2.76±3.65% vs. -5.95±4.86%, P = 0.035) (Fig. 5).
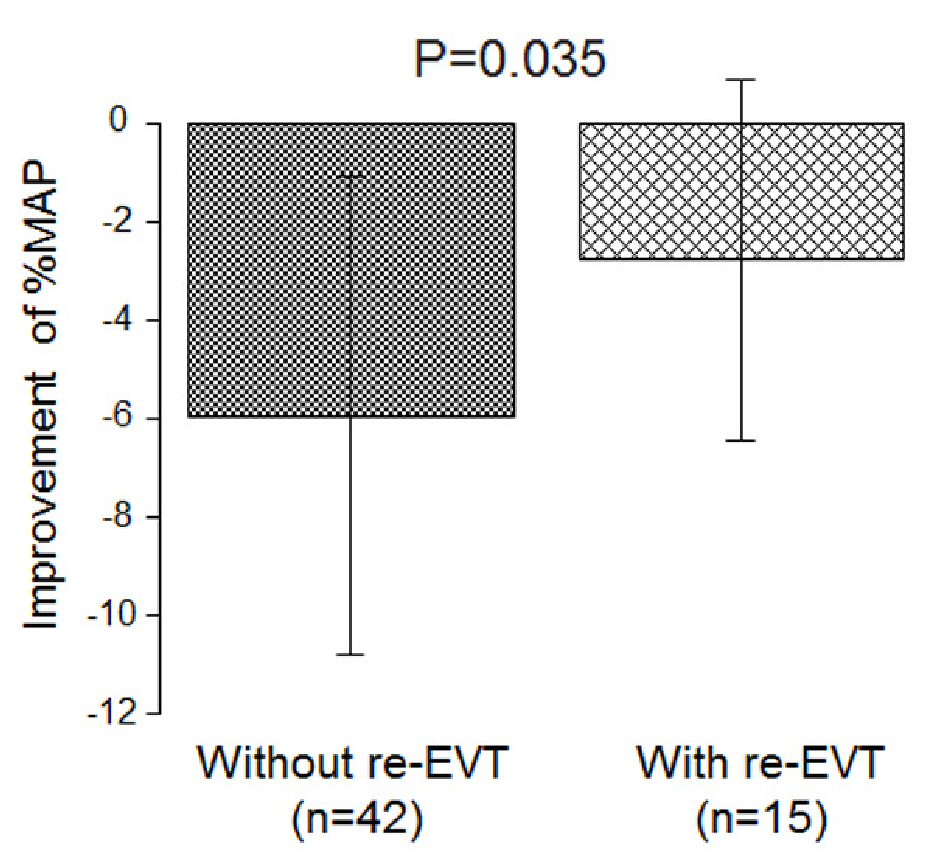 Click for large image | Figure 5. Comparison of the %MAP improvement between the patients who underwent re-EVT and those who did not undergo re-EVT (at the time of the first outpatient visit). %MAP: percentage of mean arterial pressure; EVT: endovascular treatment. |
| Discussion | ▴Top |
The number of patients with PAD may not accurately reflect the true burden because the sensitivity of an ABI < 0.90 in the detection of an atheroma in a leg artery is likely to be < 80% [1]. Arterial stenosis elevates %MAP and UT determined from pulse waves, and the normal levels of %MAP and UT are 45% and 180 ms, respectively [14]. Consideration of the ABI and %MAP improves diagnostic sensitivity for PAD. In a previous study, the frequency of accurate diagnoses based on ABI, %MAP, and UT data (ABI < 1.00, %MAP ≥ 45%, and UT ≥ 180 ms) was higher than that solely based on ABI < 1.00 [15]. In another study, using a combination of ABI and %MAP data (ABI < 0.90 and %MAP ≥ 42.5%) resulted in higher sensitivity and specificity for PAD diagnosis than the use of criteria for a low (≤ 0.90) or borderline (0.91 - 0.99) ABI [11].
However, the number of reports on the respective relationships between ABI, %MAP, and UT are limited [19]. Therefore, this study aimed to investigate the relationships between these parameters as well as the implications of their utility for EVT. In this study, the ABI and %MAP, the ABI and UT, and the %MAP and UT were correlated before EVT. Moreover, at 1 day post-EVT, these correlations were stronger than those before EVT. This finding suggests that each of these three parameters is complementary and effective to diagnose PAD. Previous reports have shown that these parameters effectively facilitate PAD diagnosis, and our results confirm this [11, 15].
This study also revealed that even after successful EVT, the extent of improvement in %MAP will be minimal if the length of the lesion is relatively long. This finding provides new insight into the implications of %MAP. No studies have reported that %MAP has any value other than being an auxiliary diagnostic indicator of PAD. Moreover, the extent of %MAP improvement depends on the extent of lesion calcification, evaluated according to the PACSS. This finding is necessary to understand the characteristics of %MAP. Because %MAP includes the area and amplitude of the arterial wave as parameters, its sensitivity may be relatively high compared to that of the ABI, which only takes into account pressure. Excessive arterial calcification is likely to result in a pseudo-normalized ABI [20]. Therefore, if there is minimal %MAP improvement, even when the ABI has appeared to improve under the condition of excessively calcified lesions, patients should be carefully monitored after successful EVT.
This study also revealed that at the time of the first outpatient visit (i.e., an average of 3.3 weeks after EVT), patients who underwent re-EVT (an average of 10.1 months after EVT) had minimal %MAP improvement compared to patients who did not undergo re-EVT. To date, %MAP has been used to diagnose PAD; however, there is no report on using it to predict disease progression after EVT. Previously, researchers have reported that lesion length is an independent predictor of in-stent restenosis [21, 22]. In this study, we revealed that %MAP improvement is dependent on the target lesion length and extent of calcification. However, even if the length of the lesion is long, it may be predicted that restenosis is not likely to occur in the patients with significant %MAP improvement. Conversely, even if EVT is successful and the ABI improves, if %MAP does not improve, restenosis of the target lesion will eventually occur. Further research is needed to validate these results.
Limitations
Several limitations of this study must be acknowledged. First, there was a selection bias because this article was a retrospective study conducted in a single hospital. Second, the number of patients included in this study was small, and the follow-up period for restenosis was limited. Third, patients with excessively low ABI values were excluded from this study. Thus, patients with severe lower-limb blood flow impairment were not included in this study.
Conclusions
The ABI, %MAP, and UT are correlated with each other. If the target lesion length is long and there is excessive calcification, the extent of %MAP improvement may be small. Additionally, minimal %MAP improvement after EVT may predict future restenosis.
Acknowledgments
None to declare.
Financial Disclosure
None to declare.
Conflict of Interest
The authors report no financial relationships or conflicts of interest regarding the content herein.
Informed Consent
All patients provided written informed consent.
Author Contributions
All authors contributed to data acquisition and analysis.
Data Availability
Any inquiries regarding supporting data availability of this study should be directed to the corresponding author.
| References | ▴Top |
- Fowkes FG, Rudan D, Rudan I, Aboyans V, Denenberg JO, McDermott MM, Norman PE, et al. Comparison of global estimates of prevalence and risk factors for peripheral artery disease in 2000 and 2010: a systematic review and analysis. Lancet. 2013;382(9901):1329-1340.
doi - Norgren L, Hiatt WR, Dormandy JA, Nehler MR, Harris KA, Fowkes FG, the TASC II Working Group. Inter-society consensus for the management of peripheral arterial disease (TASC II). J Vasc Surg. 2007;45(Suppl S):S5-67.
doi pubmed - Gerhard-Herman MD, Gornik HL, Barrett C, Barshes NR, Corriere MA, Drachman DE, Fleisher LA, et al. 2016 AHA/ACC guideline on the management of patients with lower extremity peripheral artery disease: a report of the American College of Cardiology/American Heart Association Task Force on Clinical Practice Guidelines. Circulation. 2017;135(12):e726-e779.
doi - Aboyans V, Ricco JB, Bartelink MEL, Bjorck M, Brodmann M, Cohnert T, Collet JP, et al. 2017 ESC Guidelines on the Diagnosis and Treatment of Peripheral Arterial Diseases, in collaboration with the European Society for Vascular Surgery (ESVS): Document covering atherosclerotic disease of extracranial carotid and vertebral, mesenteric, renal, upper and lower extremity arteries Endorsed by: the European Stroke Organization (ESO) the task force for the diagnosis and treatment of peripheral arterial diseases of the European Society of Cardiology (ESC) and of the European Society for Vascular Surgery (ESVS). Eur Heart J. 2018;39(9):763-816.
doi pubmed - Miyata T. Guidelines for the management of peripheral arterial occlusive diseases (JCS 2015). Circulation Journal: Official Journal of the Japanese Circulation Society. 2015.
- Aboyans V, Criqui MH, Abraham P, Allison MA, Creager MA, Diehm C, Fowkes FG, et al. Measurement and interpretation of the ankle-brachial index: a scientific statement from the American Heart Association. Circulation. 2012;126(24):2890-2909.
doi pubmed - Kinoshita M, Yokote K, Arai H, Iida M, Ishigaki Y, Ishibashi S, Umemoto S, et al. Japan Atherosclerosis Society (JAS) guidelines for prevention of atherosclerotic cardiovascular diseases 2017. J Atheroscler Thromb. 2018;25(9):846-984.
doi pubmed - Ankle Brachial Index Collaboration, Fowkes FG, Murray GD, Butcher I, Heald CL, Lee RJ, Chambless LE, et al. Ankle brachial index combined with Framingham Risk Score to predict cardiovascular events and mortality: a meta-analysis. JAMA. 2008;300(2):197-208.
doi pubmed - McDermott MM, Guralnik JM, Tian L, Liu K, Ferrucci L, Liao Y, Sharma L, et al. Associations of borderline and low normal ankle-brachial index values with functional decline at 5-year follow-up: the WALCS (Walking and Leg Circulation Study). J Am Coll Cardiol. 2009;53(12):1056-1062.
doi pubmed - Casey S, Lanting S, Oldmeadow C, Chuter V. The reliability of the ankle brachial index: a systematic review. J Foot Ankle Res. 2019;12:39.
doi pubmed - Lin HW, Lee IT. Combination of the ankle-brachial index and percentage of mean arterial pressure to improve diagnostic sensitivity for peripheral artery disease: An observational study. Medicine (Baltimore). 2018;97(39):e12644.
doi pubmed - Li YH, Lin SY, Sheu WH, Lee IT. Relationship between percentage of mean arterial pressure at the ankle and mortality in participants with normal ankle-brachial index: an observational study. BMJ Open. 2016;6(3):e010540.
doi pubmed - Watanabe Y, Masaki H, Yunoki Y, Tabuchi A, Morita I, Mohri S, Tanemoto K. Ankle-brachial index, toe-brachial index, and pulse volume recording in healthy young adults. Ann Vasc Dis. 2015;8(3):227-235.
doi pubmed - Yamashina A. Guidelines for non-invasive vascular function test (JCS 2013). Circulation Journal: Official Journal of the Japanese Circulation Society. 2013.
- Hashimoto T, Ichihashi S, Iwakoshi S, Kichikawa K. Combination of pulse volume recording (PVR) parameters and ankle-brachial index (ABI) improves diagnostic accuracy for peripheral arterial disease compared with ABI alone. Hypertens Res. 2016;39(6):430-434.
doi pubmed - Patel MR, Conte MS, Cutlip DE, Dib N, Geraghty P, Gray W, Hiatt WR, et al. Evaluation and treatment of patients with lower extremity peripheral artery disease: consensus definitions from Peripheral Academic Research Consortium (PARC). J Am Coll Cardiol. 2015;65(9):931-941.
doi pubmed - Rocha-Singh KJ, Zeller T, Jaff MR. Peripheral arterial calcification: prevalence, mechanism, detection, and clinical implications. Catheter Cardiovasc Interv. 2014;83(6):E212-220.
doi pubmed - Kanda Y. Investigation of the freely available easy-to-use software 'EZR' for medical statistics. Bone Marrow Transplant. 2013;48(3):452-458.
doi pubmed - Lee WH, Hsu PC, Huang JC, Chen YC, Chen SC, Wu PY, Lee MK, et al. Association of pulse volume recording at ankle with total and cardiovascular mortality in hemodialysis patients. J Clin Med. 2019;8(12):2045.
doi pubmed - Ato D. Pitfalls in the ankle-brachial index and brachial-ankle pulse wave velocity. Vasc Health Risk Manag. 2018;14:41-62.
doi pubmed - Ichihashi S, Shibata T, Fujimura N, Nagatomi S, Yamamoto H, Kyuragi R, Adachi A, et al. Vessel calcification as a risk factor for in-stent restenosis in complex femoropopliteal lesions after zilver PTX paclitaxel-coated stent placement. J Endovasc Ther. 2019;26(5):613-620.
doi pubmed - Soga Y, Iida O, Hirano K, Suzuki K, Tosaka A, Yokoi H, Nobuyoshi M. Utility of new classification based on clinical and lesional factors after self-expandable nitinol stenting in the superficial femoral artery. J Vasc Surg. 2011;54(4):1058-1066.
doi pubmed
This article is distributed under the terms of the Creative Commons Attribution Non-Commercial 4.0 International License, which permits unrestricted non-commercial use, distribution, and reproduction in any medium, provided the original work is properly cited.
Cardiology Research is published by Elmer Press Inc.