

| Cardiology Research, ISSN 1923-2829 print, 1923-2837 online, Open Access |
| Article copyright, the authors; Journal compilation copyright, Cardiol Res and Elmer Press Inc |
| Journal website http://www.cardiologyres.org |
Editorial
Volume 8, Number 5, October 2017, pages 179-183
Pathophysiology and Current Evidence for Detection of Dyssynchrony
Michael Spartalis, d, Eleni Tzatzaki, Eleftherios Spartalisb, Christos Damaskosb, Antonios Athanasiouc, Efthimios Livanis, Vassilis Voudris
aDivision of Cardiology, Onassis Cardiac Surgery Center, Athens, Greece
bLaboratory of Experimental Surgery and Surgical Research, University of Athens, Medical School, Athens, Greece
cDepartment of Surgery, Mercy University Hospital, Cork, Ireland
dCorresponding Author: Michael Spartalis, Division of Cardiology, Onassis Cardiac Surgery Center, 356 Syggrou Ave., Athens 17674, Greece
Manuscript submitted August 21, 2017, accepted September 18, 2017
Short title: Editorial
doi: https://doi.org/10.14740/cr598w
Cardiac dyssynchrony is divided into electrical dyssynchrony and mechanical dyssynchrony. Electrical dyssynchrony is associated with a prolonged conduction time in the ventricles resulting in a prolonged QRS duration [1]. Mechanical dyssynchrony presents the mechanical discoordination that is most often related to simultaneous contraction and stretch in different segments of the left ventricle (LV) as well as delays in the time to peak contraction from one segment to another [1].
Dyssynchrony comprises three main components: atrioventricular (AV), interventricular and intraventricular.
AV dyssynchrony is a delay in the normal sequential AV contraction, due to delayed conduction through the AV node. The result is a disordered ventricular diastolic filling and a decreased LV preload that compromises stroke volume (due to the failure of the Starling mechanism) [1, 2]. AV dyssynchrony is defined by an LV filling time (LVFT) indexed to R-R interval < 40% [1, 2] (Fig. 1 [3]).
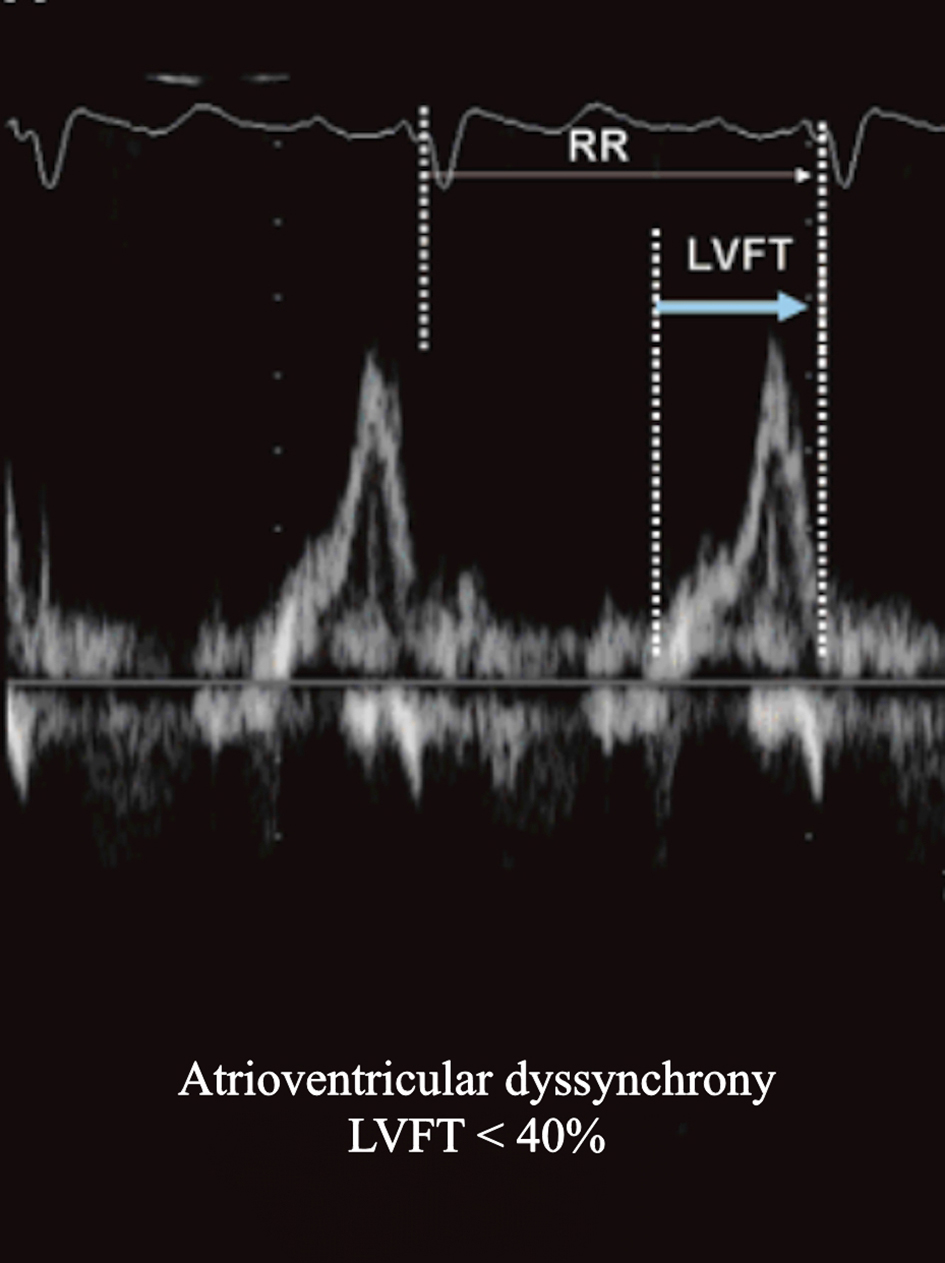 Click for large image | Figure 1. Transthoracic echocardiography with pulsed wave (PW) Doppler of the transmitral flow showing atrioventricular dyssynchrony with a left ventricular filling time (LVFT) < 40% of the R-R interval (cardiac cycle). Adapted from Kapoor [3]. |
Interventricular dyssynchrony and intraventricular dyssynchrony have a relatively greater effect on ventricular pump function than AV dyssynchrony. Interventricular dyssynchrony describes a sequential delay in activation between the right ventricle (RV) and LV, resulting in a lack of coordinated contraction [4]. Interventricular dyssynchrony is evaluated by the measurement of interventricular mechanical delay (IVMD), pulse wave (PW) aortic (left ventricular outflow tract, apical five-chamber view) and pulmonary (right ventricular outflow tract, parasternal short-axis view) flow velocities. It is also estimated by the calculation of the difference in time between the beginning of Q wave (ECG) and the onset of LV outflow and the time between the beginning of Q and the onset of RV outflow [1, 5]. These values represent left and right ventricular pre-ejection period (PEP). IVMD values of > 40 ms and values of LV PEP of > 140 ms are considered pathological [1, 5, 6] (Fig. 2 [3]).
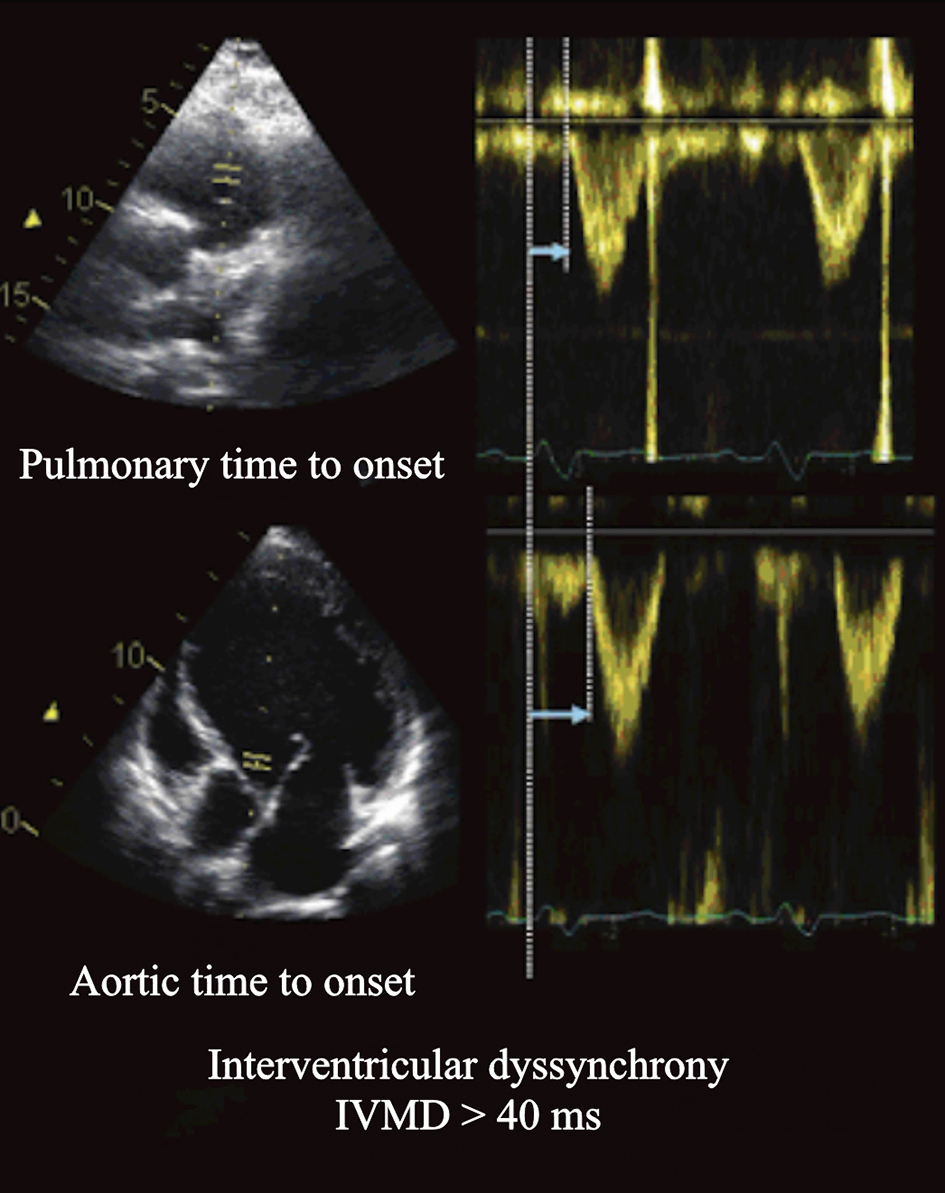 Click for large image | Figure 2. Parasternal short-axis view of transthoracic echocardiography with PW Doppler image of pulmonary flow velocity (right ventricular outflow tract) and apical five-chamber view with PW Doppler image of aortic flow velocity (left ventricular outflow tract). Assessment of interventricular dyssynchrony by measuring the time delay between the onset of the right and left ventricular ejections. Adapted from Kapoor [3] |
In left bundle branch block (LBBB), the anterior surface of the RV is the earliest to depolarize (due to rapid electrical propagation through the intact right bundle branch), and the posterolateral basal LV is mostly the latest (due to the relatively slow propagation from cell to cell). The hemodynamic consequences of dyssynchronous LV contraction are decreased stroke volume, stroke work, a slower rate of rising of LV pressure and increased LV end-systolic wall stress. Additionally, the LV end-systolic pressure-volume curve shifts to the right, indicating that the LV functions at a larger volume to recruit the Frank-Starling mechanism [1, 5, 6].
Intraventricular dyssynchrony is evaluated by M-mode, pulsed tissue Doppler, speckle tracking (STE), color tissue velocity imaging and 3D echocardiography [1, 5, 6].
In M-mode septal to posterior wall motion delay (SPWMD) is measured. It is the difference in timing of septal and posterior wall contraction [1, 5]. SPWMD > 130 ms is considered pathological and predicts inverse LV remodeling and long-term clinical improvement after cardiac resynchronization therapy (CRT) with 63% specificity, 100% sensitivity, and 85% accuracy [1, 2, 4-7] (Fig. 3 [3]).
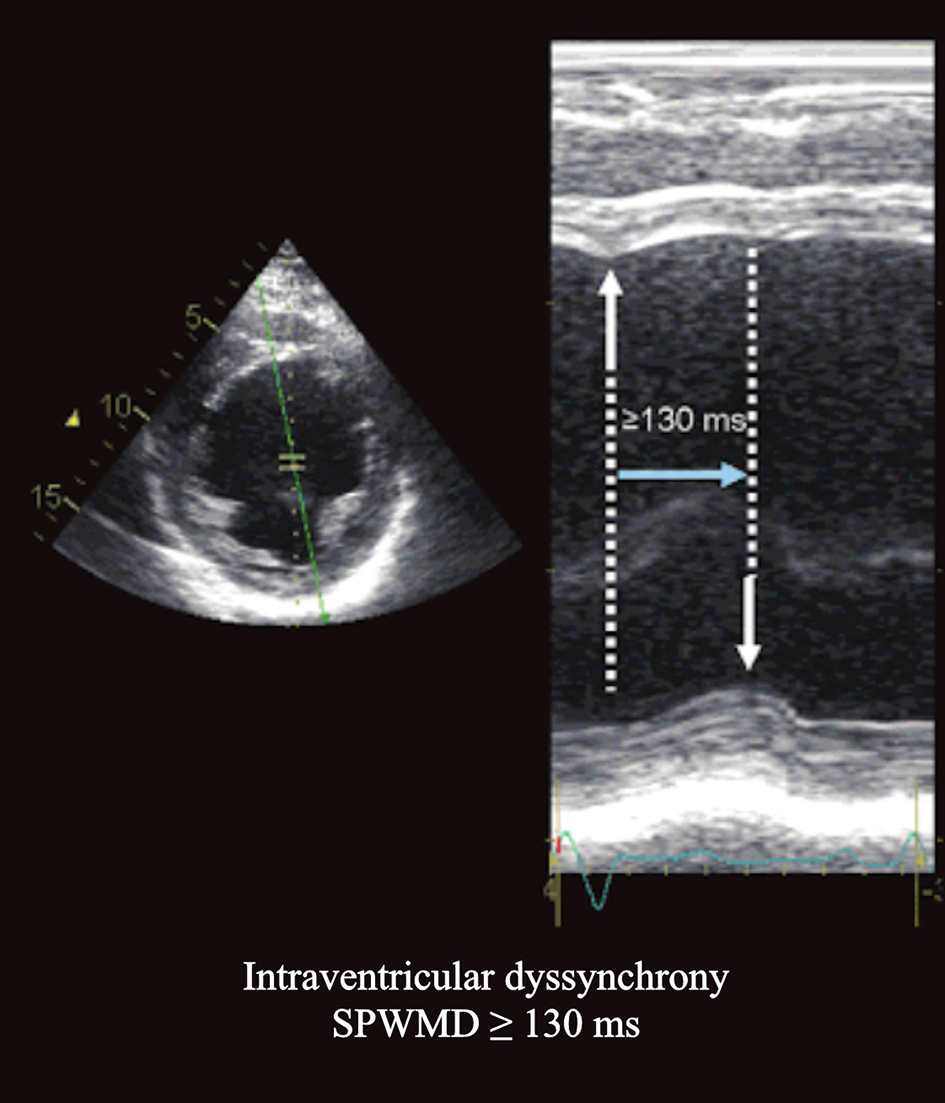 Click for large image | Figure 3. Parasternal short-axis view at the papillary muscle level M-mode tracing showing the systolic septal inward motion occurring > 130 ms earlier than the posterior inward motion. Adapted from Kapoor [3] |
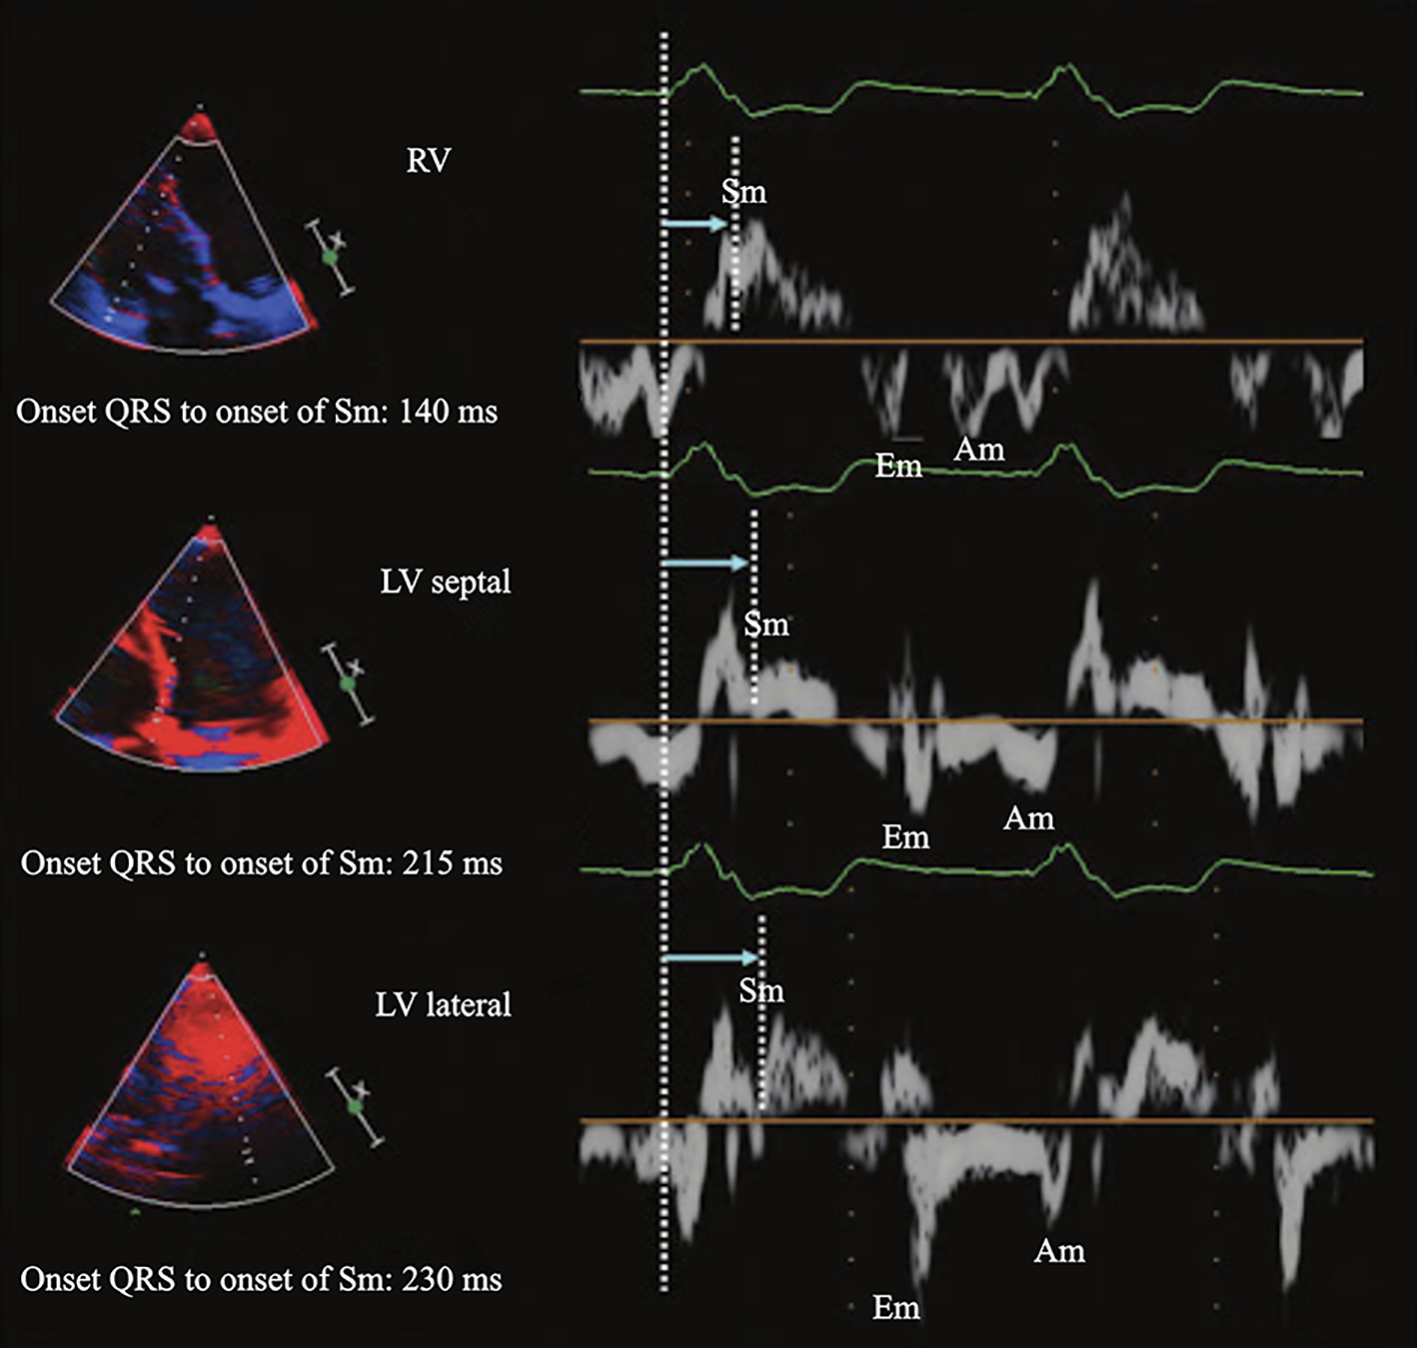
Using PW tissue Doppler, the following are derived: the time interval amidst the beginning of the QRS complex and the Sm peak (mitral annular peak systolic velocity) and the time interval from the beginning of the QRS to the onset of Sm, which corresponds to LV PEP (Figs. 4 and 5). IVMD has been defined for differences of > 65 ms of time to Sm peak between segments [1, 2, 4-7] (Fig. 6). A dyssynchrony index (DI) can be estimated as the standard deviation (SD) of the average values of time to peak systolic velocities (Ts-SD). Ts-SD of > 32.6 ms predicts inverse LV remodeling after CRT with 100% specificity, 100% sensitivity and 100% accuracy in 30 candidates to CRT [1, 2, 4-7].
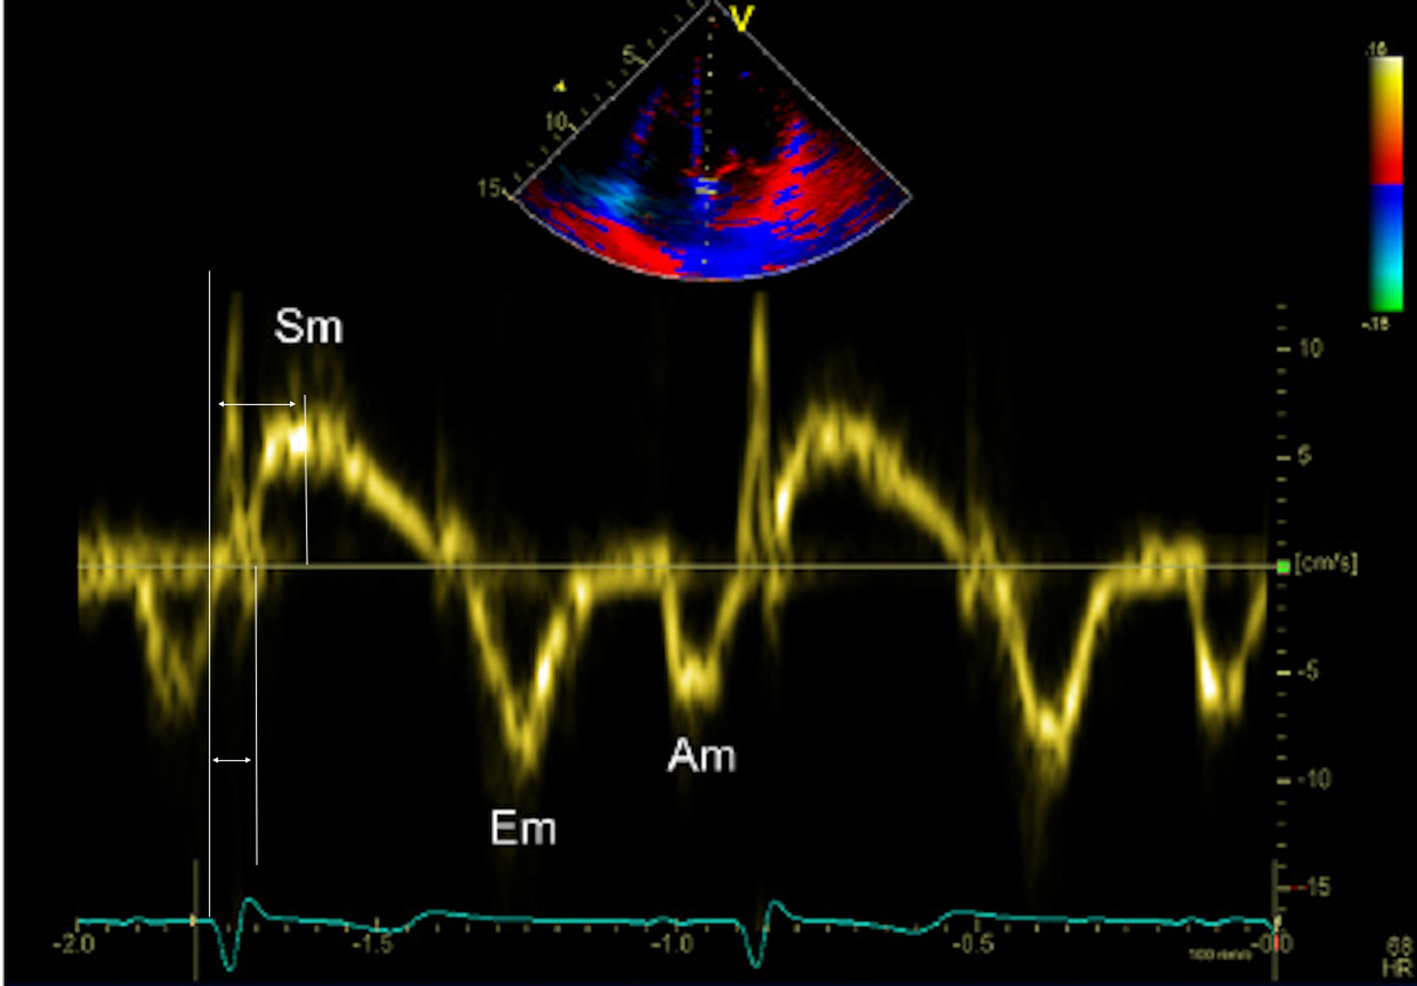 Click for large image | Figure 4. Methodology for measuring pulsed wave tissue Doppler derived time to peak Sm and time to onset Sm. Am: late diastolic velocity; Em: early diastolic velocity; Sm: peak systolic velocity. |
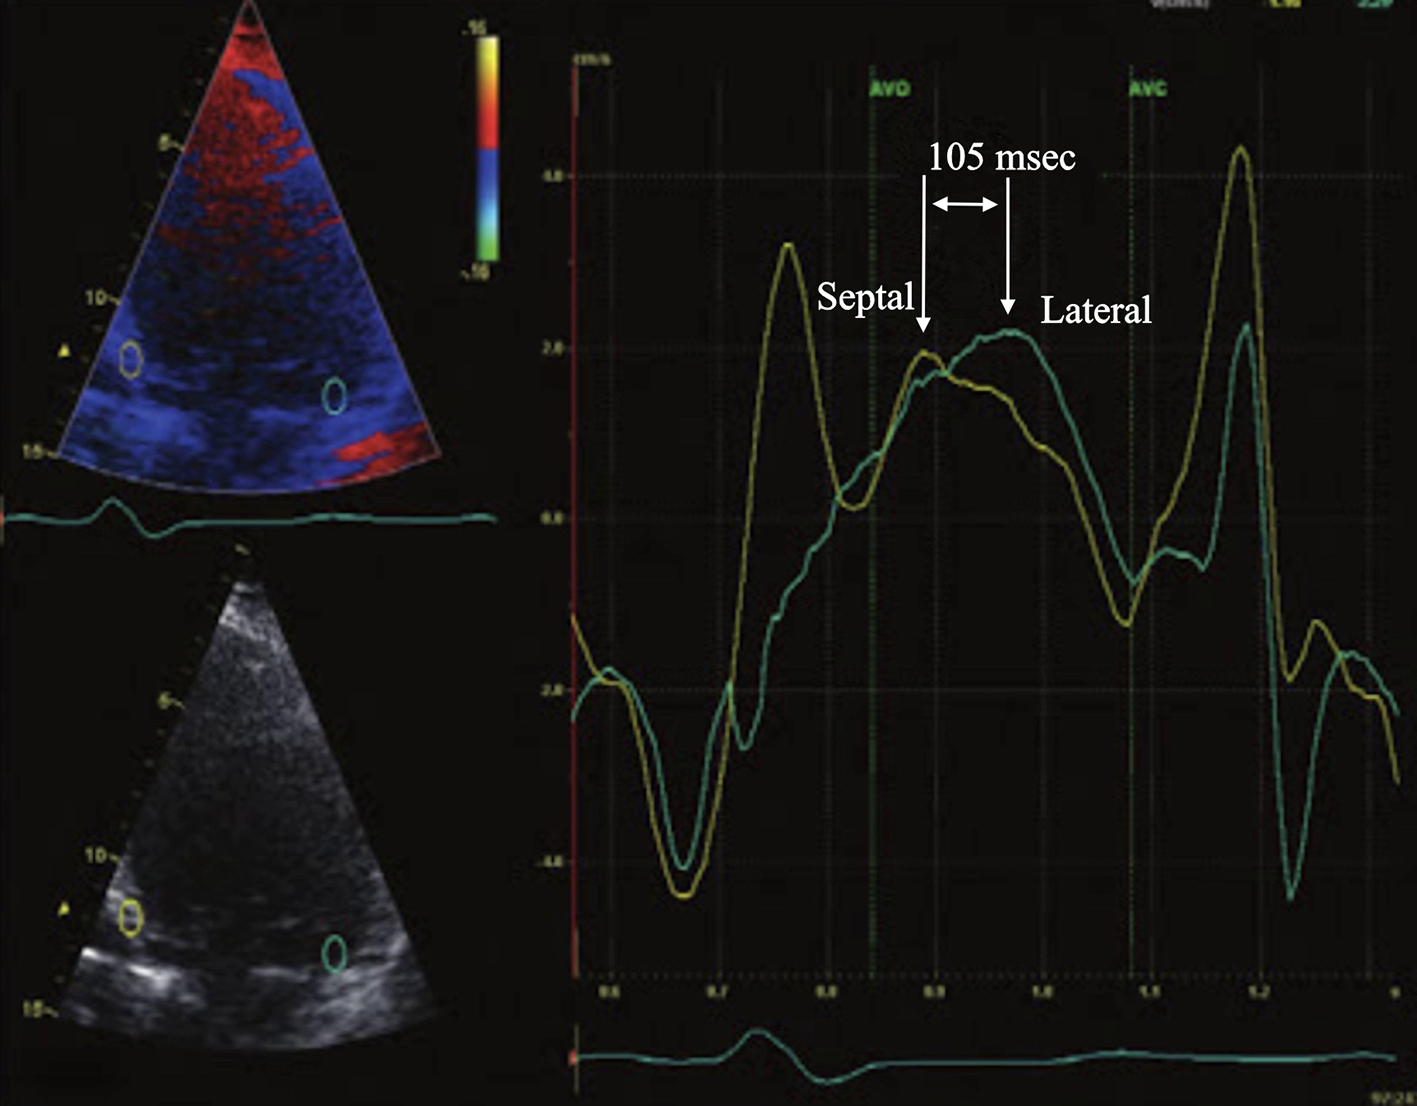
 Click for large image | Figure 5. Example of left ventricular (LV) dyssynchrony assessed with pulsed wave tissue Doppler imaging showing substantial interventricular dyssynchrony (right ventricular free wall to LV lateral wall delay of 90 ms) but not LV dyssynchrony with a time delay of 15 ms between LV septal and lateral walls. |
 Click for large image | Figure 6. Apical four-chamber view of transthoracic echocardiography with color-coded tissue Doppler imaging showing significant time delay between the septal and the lateral wall (> 65 ms). |
Speckle tracking is a 2D strain technique and has been used to assess radial dyssynchrony before and after CRT. STE has been applied to routine mid-ventricular short-axis images to calculate radial strain from multiple circumferential points averaged to six standard segments [1, 2, 4-7]. Dyssynchrony from the timing of peak radial strain has been demonstrated to be correlated with tissue Doppler measures. A time difference >130 m between the radial strain peak of LV posterior wall and anterior septum has proven to be highly predictive of an increased ejection fraction (EF) during follow-up, with 83% specificity and 89% sensitivity [1, 2, 4-7] (Fig. 7 [3]).
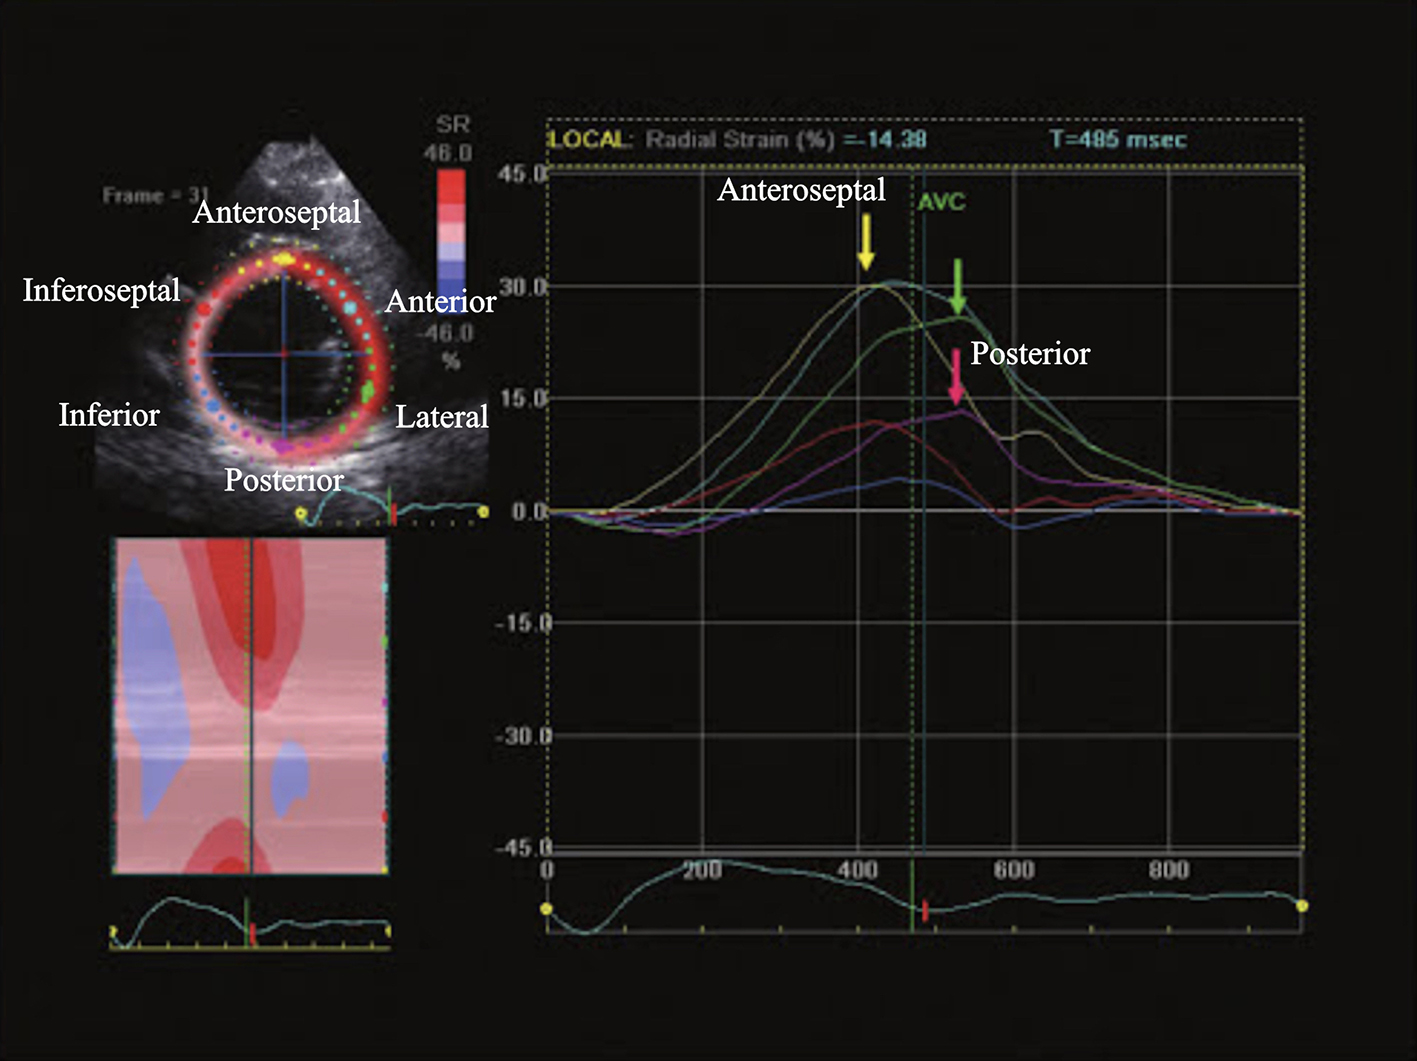 Click for large image | Figure 7. Parasternal short-axis view of transthoracic echocardiography, time-radial strain tracing. A time delay of ≥ 130 ms between peak radial strain of the anteroseptal (yellow arrow) and the posterior (purple arrow) segments demonstrate the presence of left ventricular dyssynchrony. Adapted from Kapoor [3] |
The 3D echocardiography allows intraventricular dyssynchrony to be evaluated by analyzing LV wall motion in multiple apical planes during the same cardiac cycle. The 3D echocardiography offers better spatial resolution than a single plane [1, 2, 4-7]. The global LV volumetric dataset has been utilized to present a systolic dyssynchrony index (SDI) that correlates to the SD of the average of the time intervals needed by multiple LV segments to reach minimum end-systolic volume ([1, 2, 4-7]. This index is calculated as the percent value of the overall cardiac cycle and can be used to compare patients with different heart rates. Normal subjects have a well-synchronized segmental function (SDI 3.5%). CRT responders show a significant reduction of this 3D DI, which parallels the reduction of LV end-diastolic volume and the increase in EF [1, 2, 4-7] (Fig. 8).
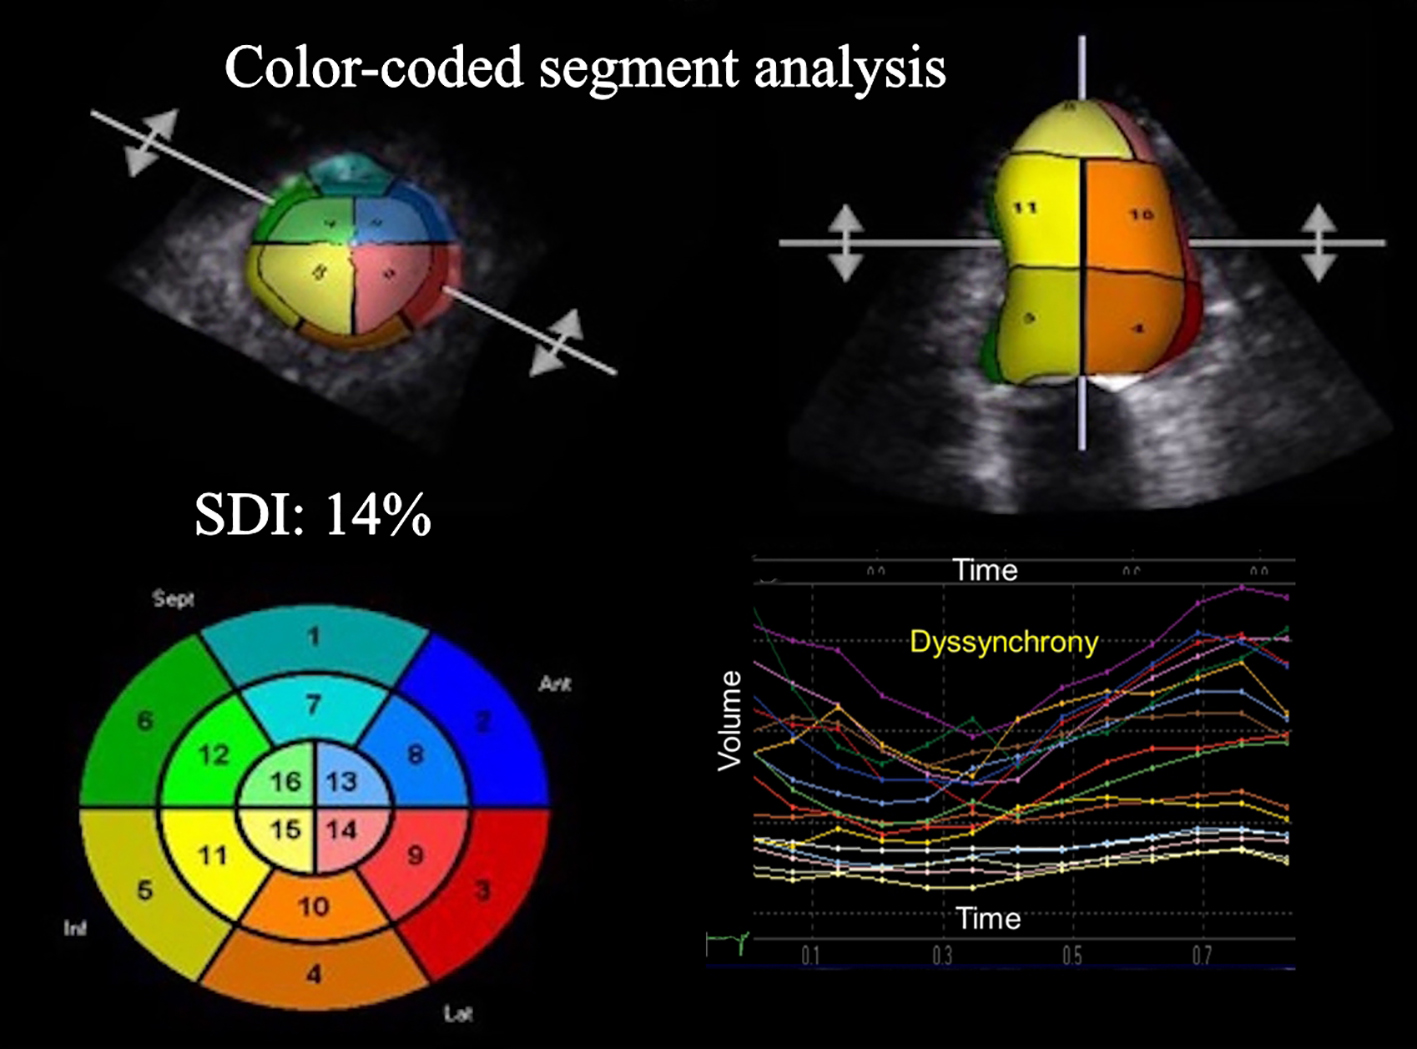 Click for large image | Figure 8. 3D echocardiography color-coded polar map showing the most delayed areas (left ventricular dyssynchrony, SDI 14%). SDI: systolic dyssynchrony index derived from the standard deviation of the average of time intervals needed by multiple LV segments to reach minimal end-systolic volume. |
By restoring AV, interventricular synchrony and intraventricular synchrony, CRT can produce acute and sustained improvements in LV contractility, and response can be assessed by the increase in LV contractility. The improvement is measurable acutely as an increase in dp/dt and arterial pulse pressure, and a decrease in pulmonary capillary wedge pressure [1, 2].
Financial Support
This research received no specific grant from any funding agency, commercial or not-for-profit sectors.
Conflict of Interest
All authors have contributed and approved the final version of this manuscript. No author has any conflict of interest to disclose.
| References | ▴Top |
- Gorcsan J 3rd, Marek JJ, Onishi T. The contemporary role of echocardiography in improving patient response to cardiac resynchronization therapy. Curr Cardiovasc Imaging Rep. 2012;5(6):462-472.
doi pubmed - Khan SG, Klettas D, Kapetanakis S, Monaghan MJ. Clinical utility of speckle-tracking echocardiography in cardiac resynchronisation therapy. Echo Res Pract. 2016;3(1):R1-R11.
doi pubmed - Kapoor PM. Review of Cardiac Anesthesia and Cardiac Critical Care with 2,100 MCQs. 1st ed. New Delhi: Jaypee Brothers Medical Publishers, 2013:277-295.
- Bonadei I, Vizzardi E, D’Aloia A, Quinzani F, Magatelli M, Salghetti F, Curnis A, et al. [Role of echocardiography on the diagnosis is ventricular dyssynchrony in patients selected for cardiac resynchronization]. Recenti Prog Med. 2013;104(2):76-79.
pubmed - Gorcsan J, 3rd, Tayal B. Newer echocardiographic techniques in cardiac resynchronization therapy. Heart Fail Clin. 2017;13(1):53-62.
doi pubmed - van Everdingen WM, Schipper JC, van’t Sant J, Ramdat Misier K, Meine M, Cramer MJ. Echocardiography and cardiac resynchronisation therapy, friends or foes? Neth Heart J. 2016;24(1):25-38.
doi pubmed - Bonadei I, Vizzardi E, Gorga E, Carubelli V, Pagnoni M, Sciatti E, Raweh A, et al. Role of the old and new echocardiographic technologies in cardiac resynchronization therapy. Minerva Cardioangiol. 2016;64(5):572-580.
pubmed
This article is distributed under the terms of the Creative Commons Attribution Non-Commercial 4.0 International License, which permits unrestricted non-commercial use, distribution, and reproduction in any medium, provided the original work is properly cited.
Cardiology Research is published by Elmer Press Inc.